1. The data
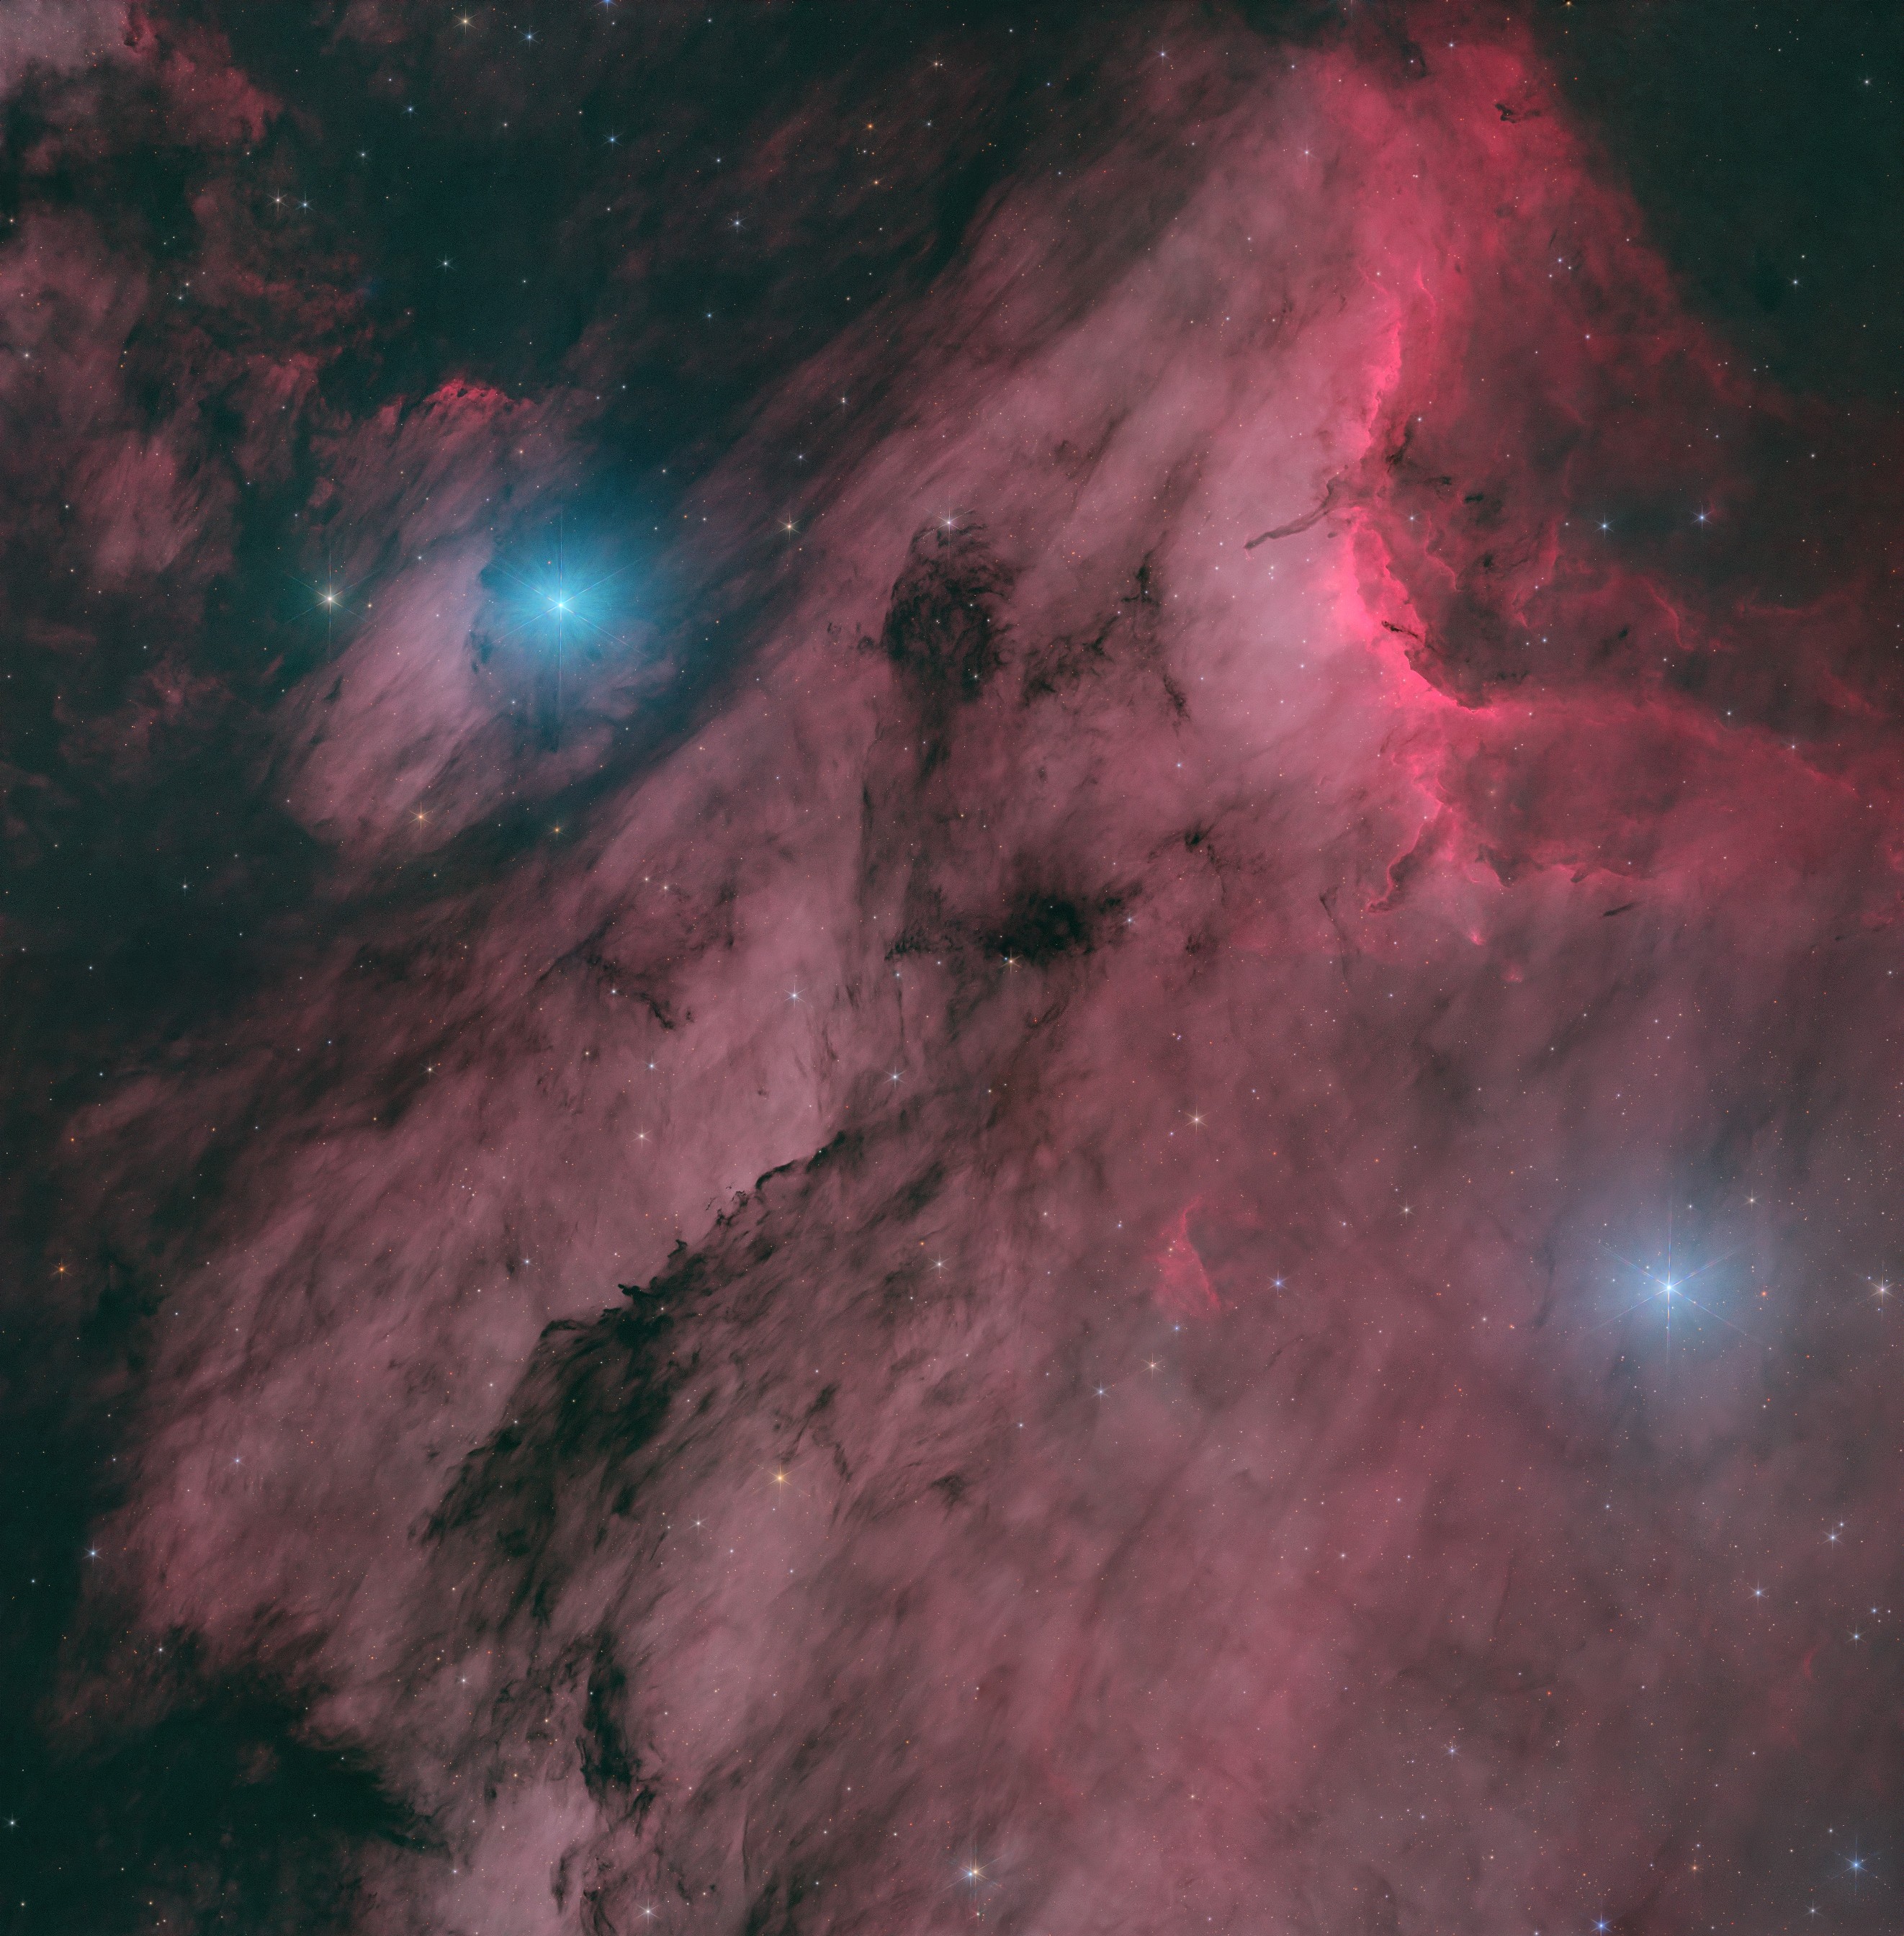
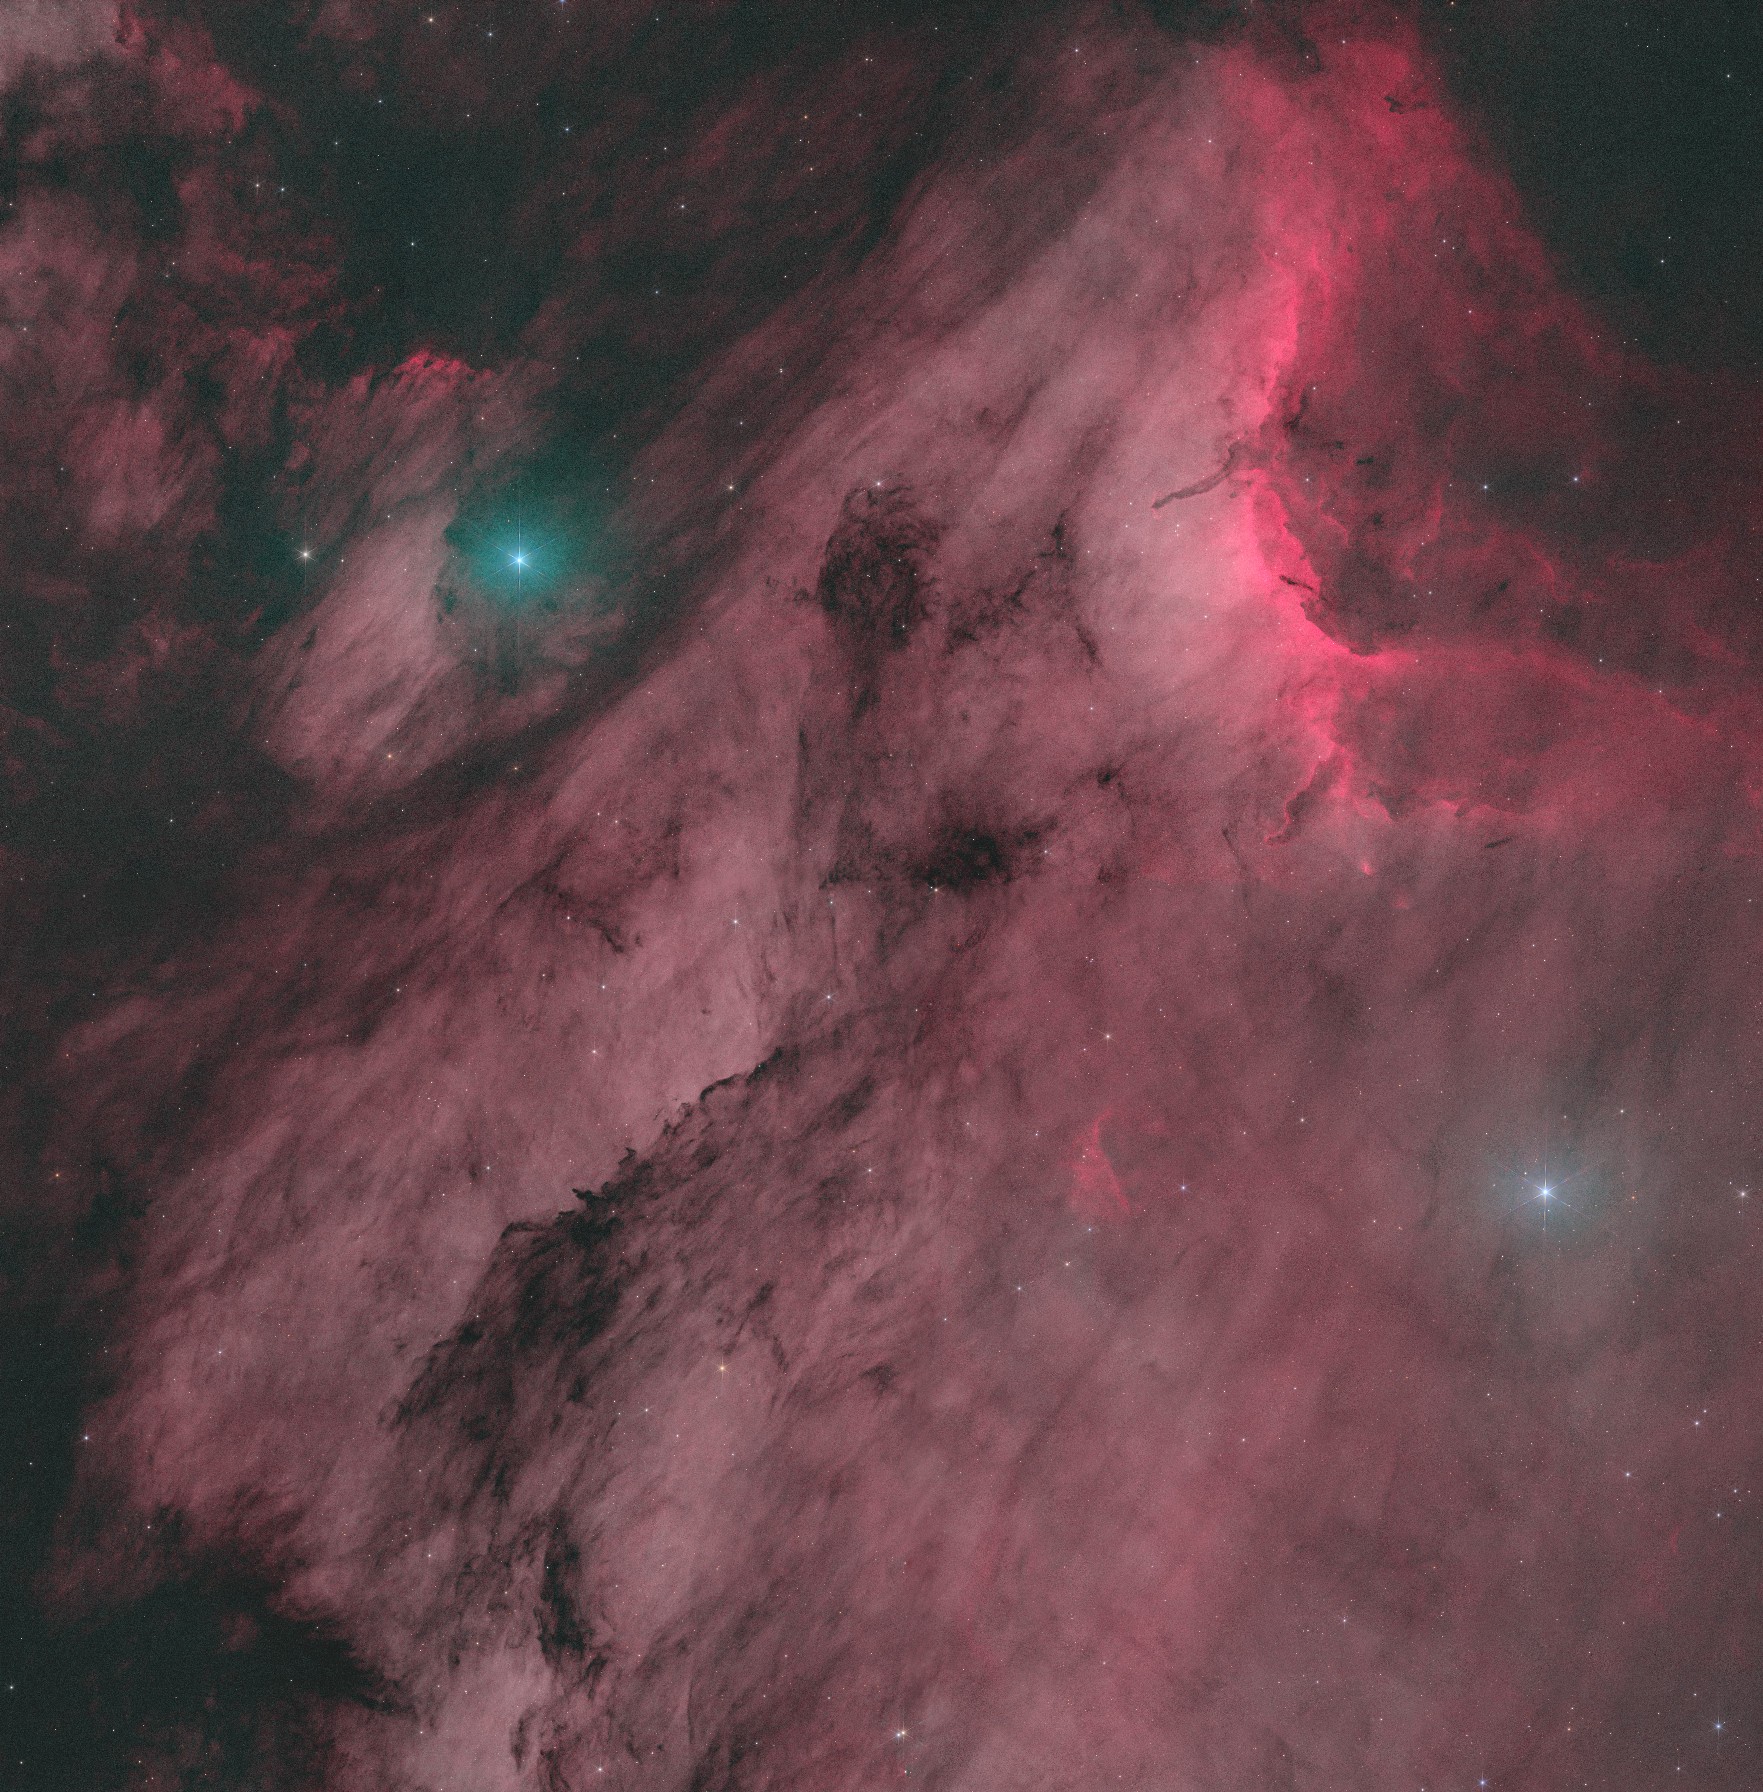
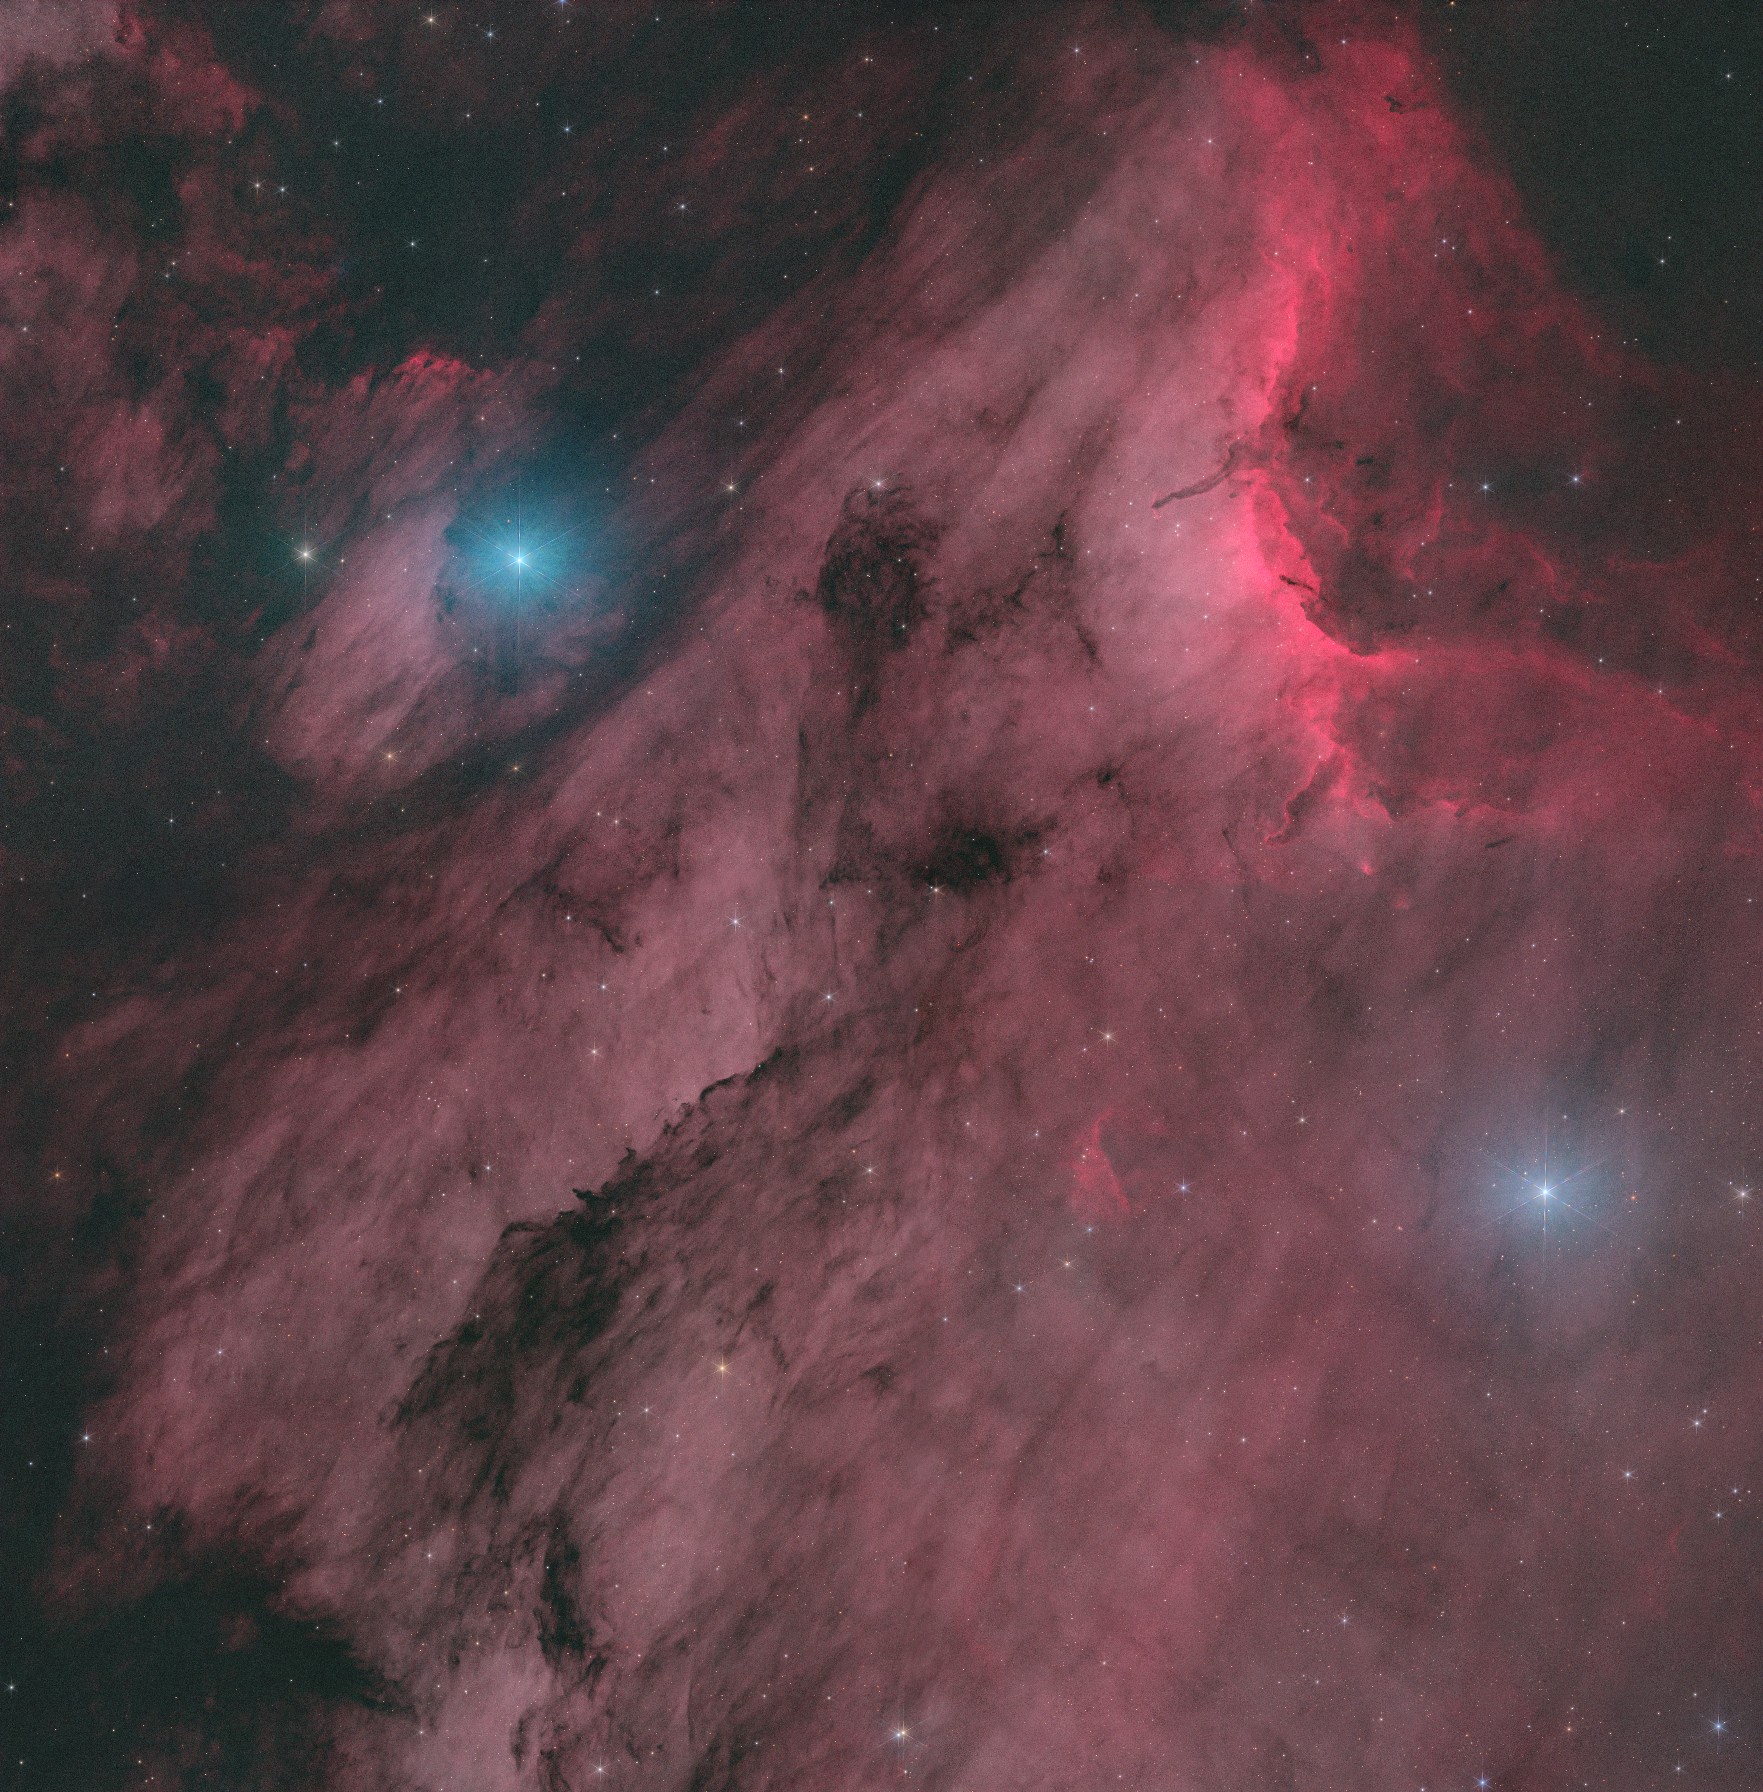
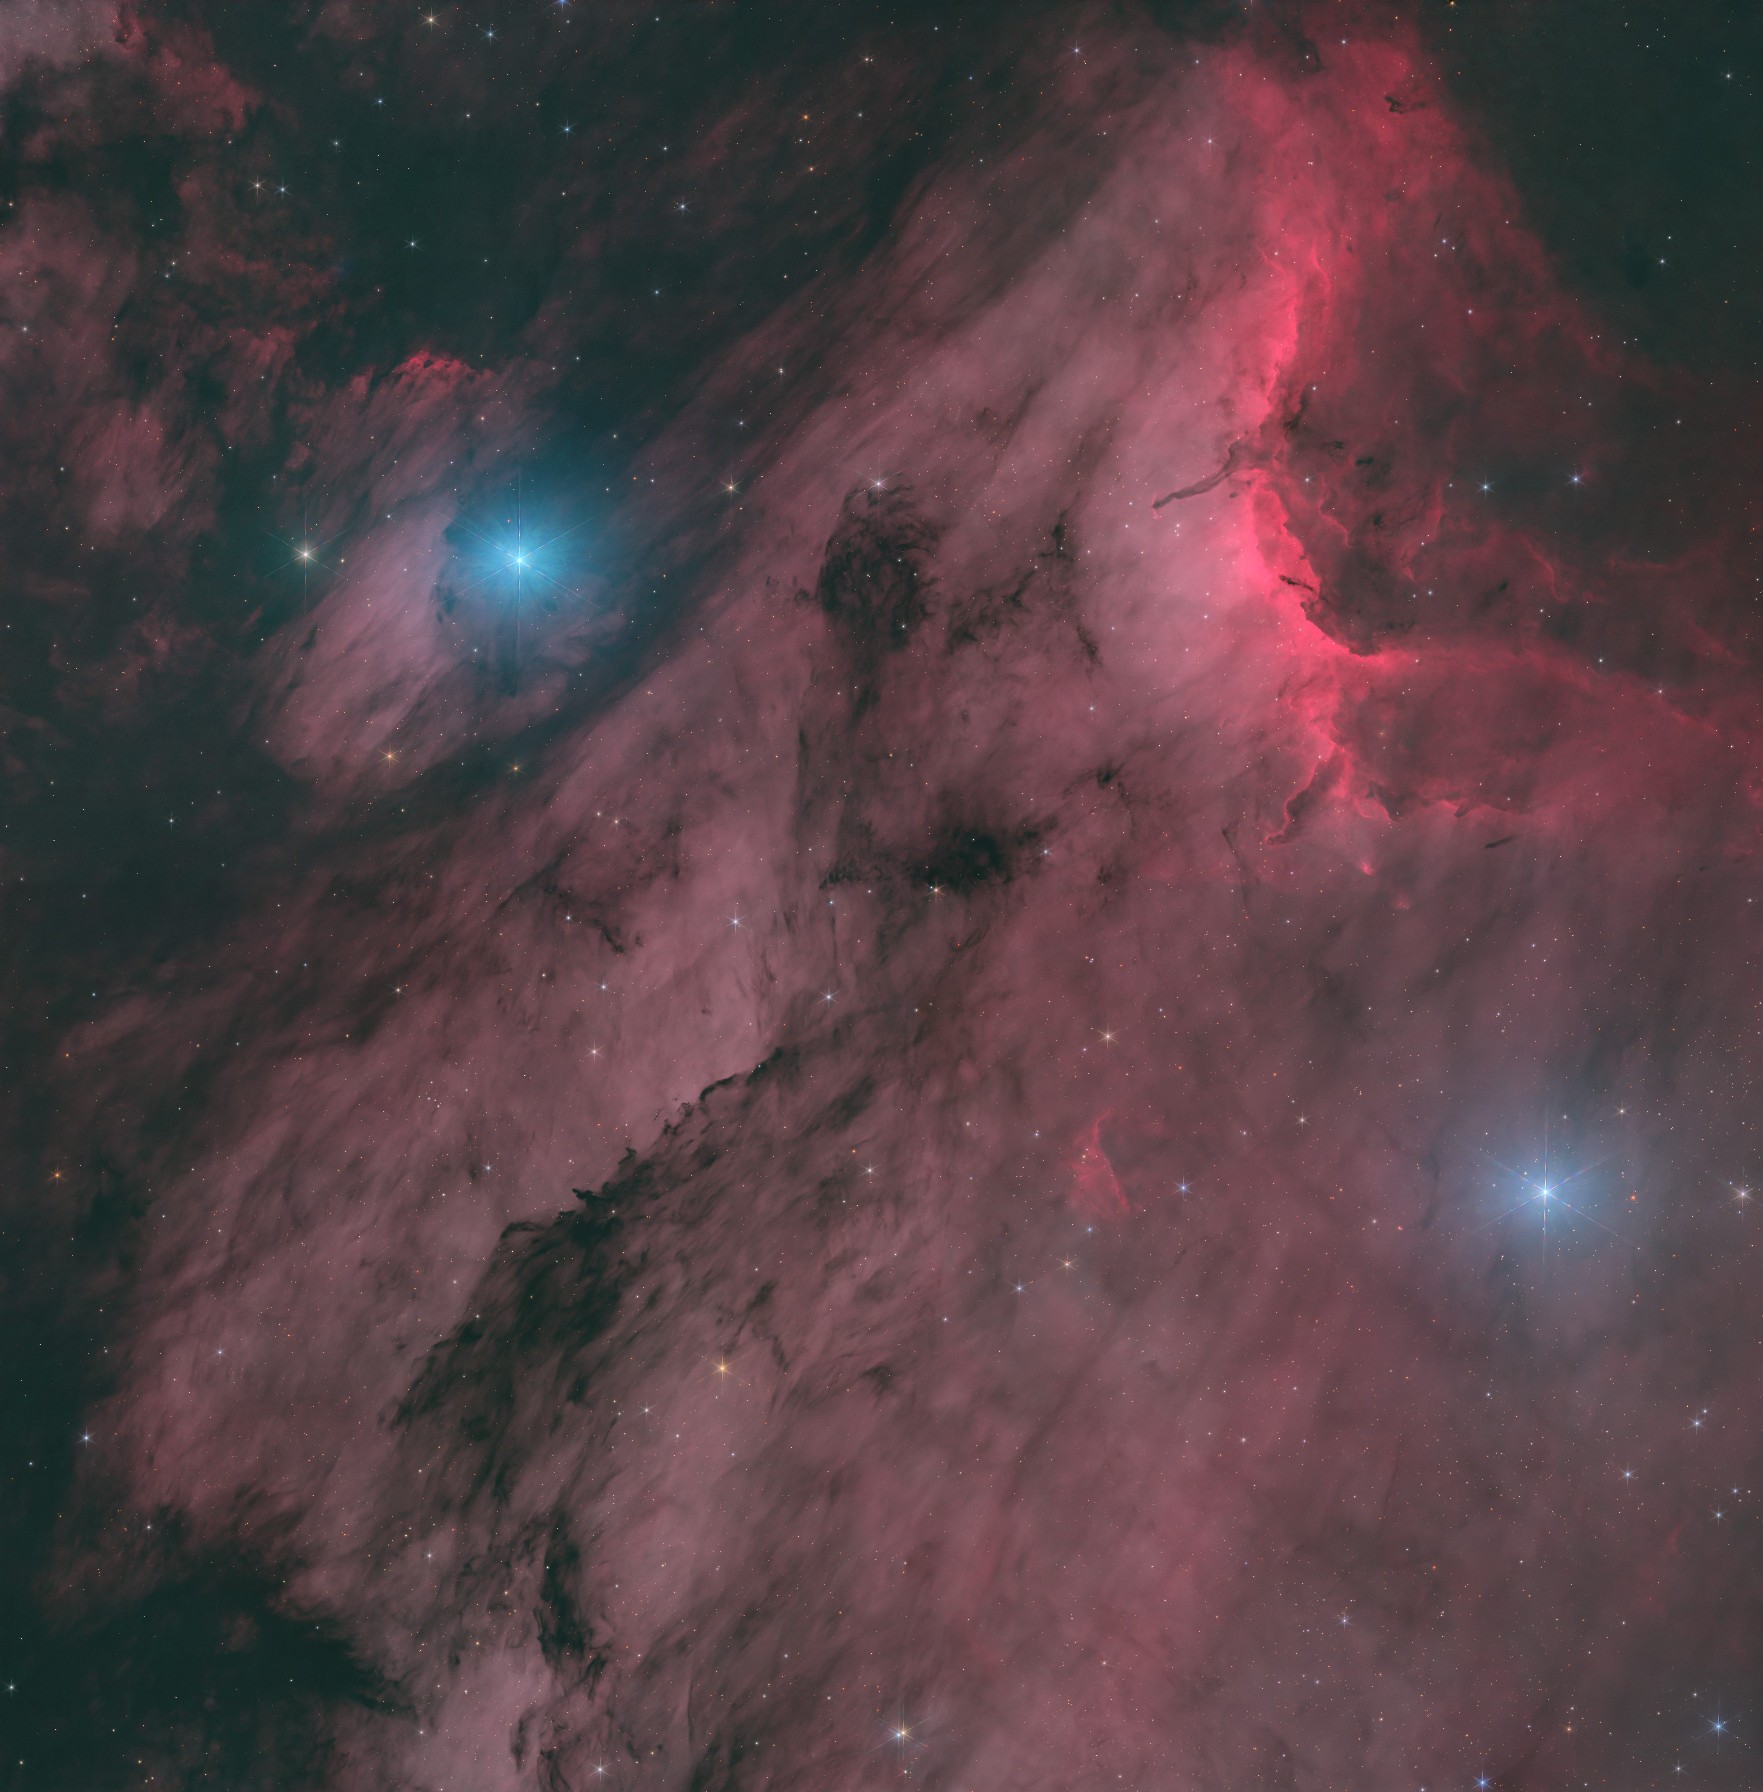
The target is IC 5070, the Pelican Nebula, shot as a four-panel mosaic with a mono camera. Every panel has five filters: Astronomik Deep Sky R, G, B (30 s subs) and 6 nm Hα (656.30 nm) and OIII (500.70 nm) at 180 s. The camera ran at gain 105, offset 70 and −15 °C. The plate solutions give an image scale of about 0.65″/px. (The focal length and pixel size written in the FITS headers are not used here: they do not agree with the camera’s specification.) Data were collected over eight sessions, each with its own flats (mostly taken with the Flat Wizard).
These are the frames that actually went into WBPP, counted from the WBPP log:
| Filter | Panel 1 | Panel 2 | Panel 3 | Panel 4 | Total | Sub length | Integration |
|---|---|---|---|---|---|---|---|
| R | 69 | 92 | 77 | 59 | 297 | 30 s | 2 h 28 m |
| G | 68 | 90 | 76 | 48 | 282 | 30 s | 2 h 21 m |
| B | 75 | 101 | 75 | 53 | 304 | 30 s | 2 h 32 m |
| Hα | 31 | 33 | 49 | 37 | 150 | 180 s | 7 h 30 m |
| OIII | 34 | 33 | 43 | 33 | 143 | 180 s | 7 h 09 m |
| All | 1,176 | ≈22 h |
2. Frame review before WBPP
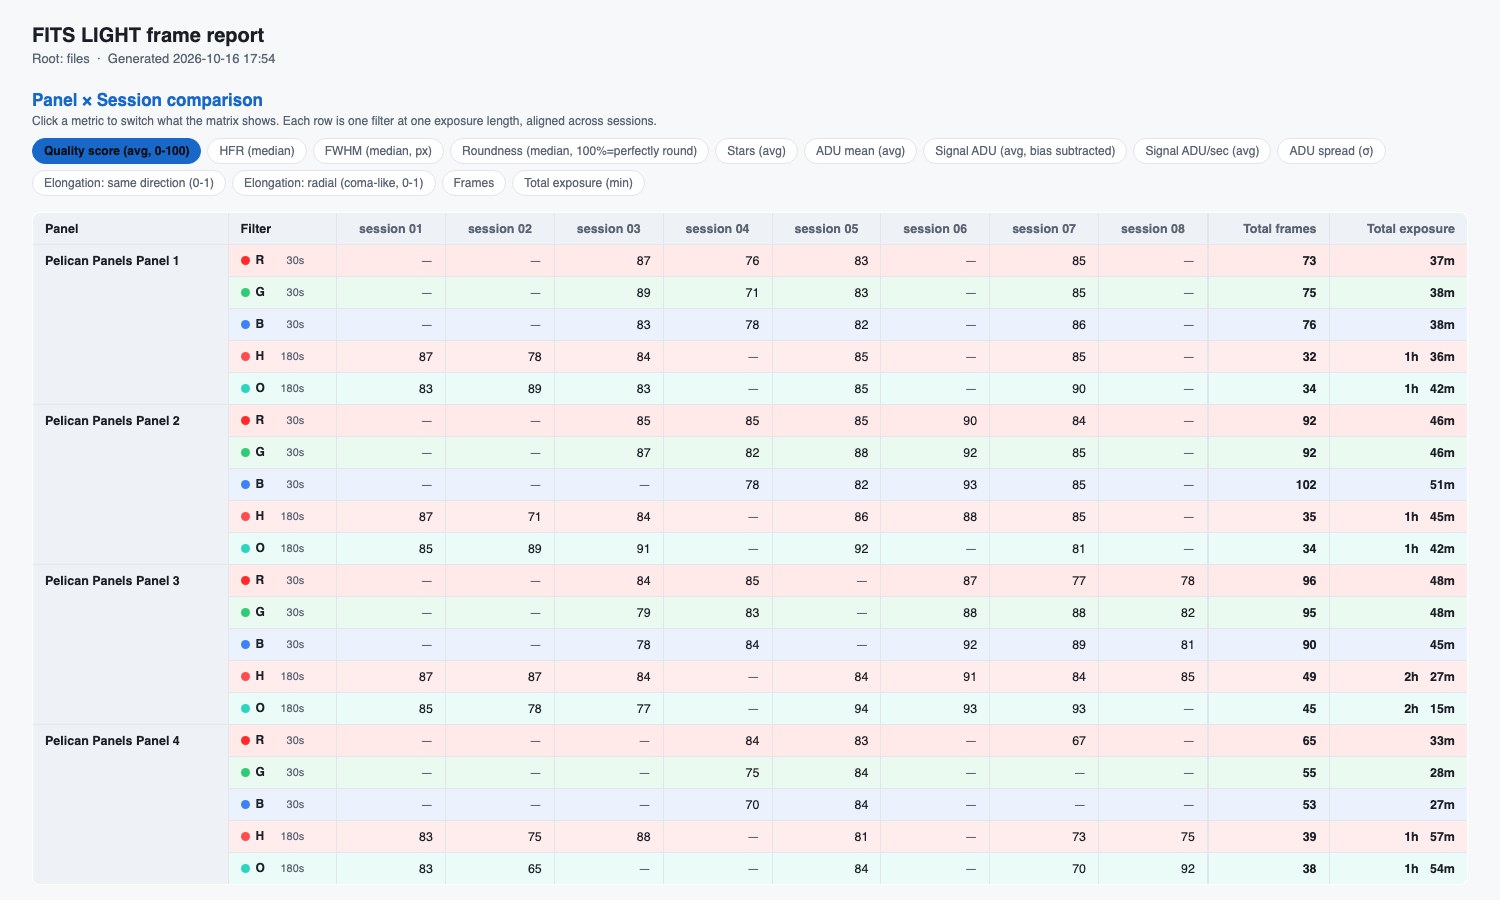
Before WBPP, every light frame went through a small home-made review tool (a Python script that reads each FITS file and computes HFR, FWHM, star count, roundness, ADU statistics and an overall quality score from 0 to 100). It builds a panel × session matrix so a weak session stands out immediately, and a local review page lets me preview a frame and mark it for deletion.
The tool can also calibrate with darks and flats, so the frames are judged on what WBPP will actually see rather than on raw data. Pointed at the folder with the master bias and master darks, it matches each light to the dark of the same exposure time, builds a master flat from each session’s own flats (a night’s flats only ever calibrate that night’s lights), subtracts and divides, and measures the calibrated frame. The “Cal” column in the tables says what was applied (D+F means dark and flat), and calibrated copies can optionally be saved. In the viewer a Raw / Calibrated toggle switches between the sensor data and the calibrated frame, which makes hot pixels, dust shadows and flat-field problems visible before any batch run.
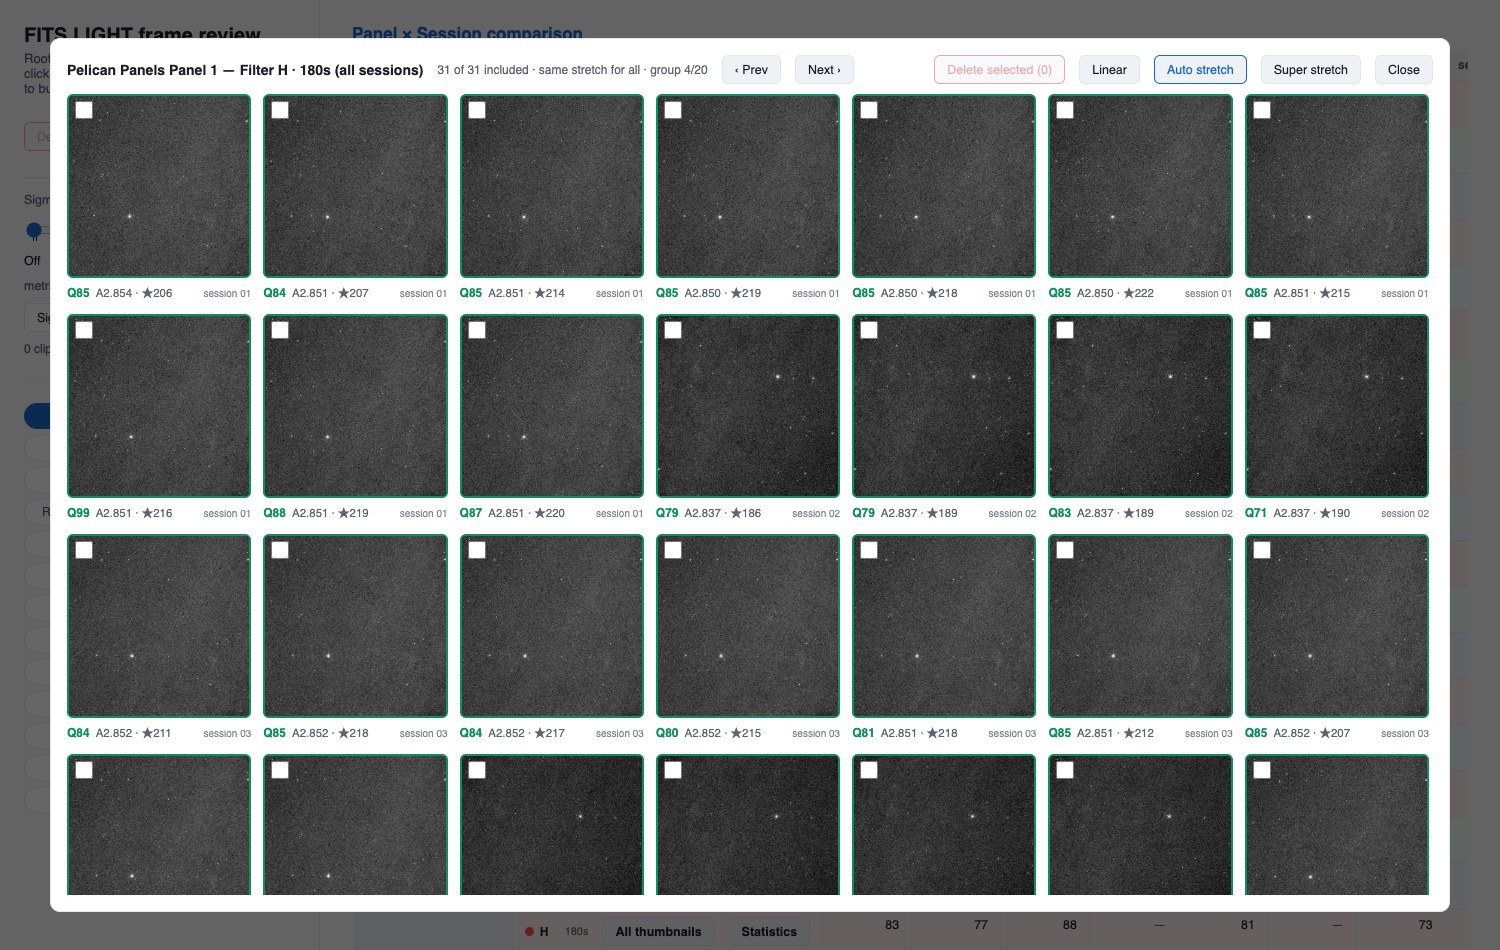
Clicking a filter row opens every frame of that panel and filter across all sessions as a thumbnail grid, all stretched with the same settings, so a drifting, trailed or cloud-affected sub is obvious next to its neighbours. Each tile shows the quality score, the median HFR (the “A2.85” figure) and the star count.
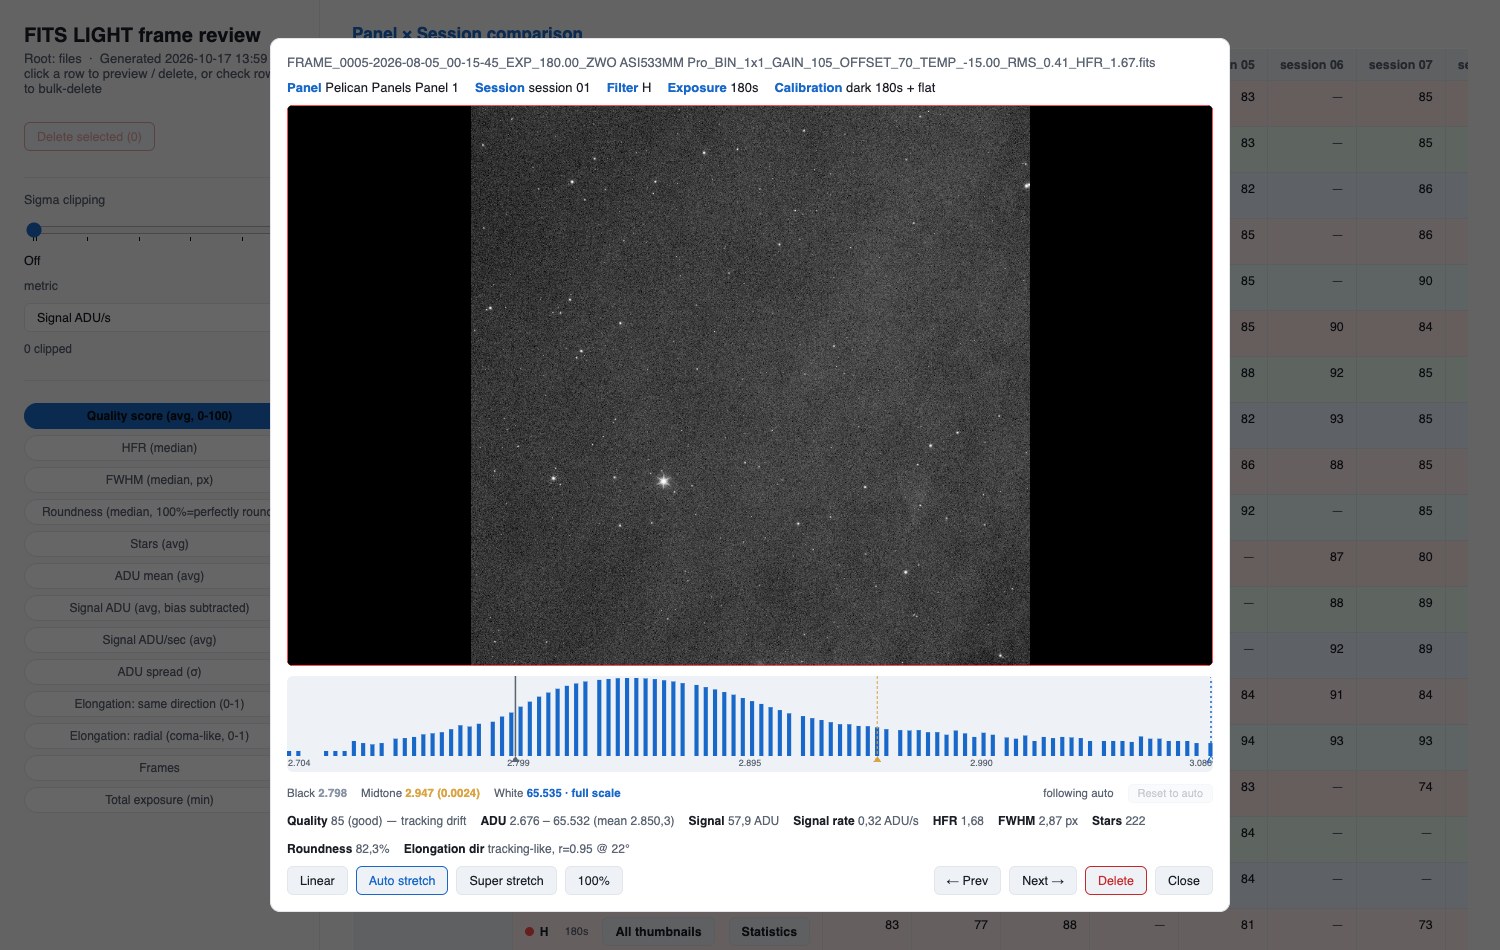
Opening a single frame shows a live auto-stretched preview with its histogram and numbers, and the Delete button moves the file to a _deleted folder instead of erasing it, so a rejection can be undone.
The review state file records 94 frames marked as deleted (R 29, G 35, B 17, H 5, O 8). That matches exactly the difference between the frame counts in the report (326 R, 317 G, 321 B, 155 H, 151 O) and the frame counts WBPP received, so the review step happened before WBPP and its rejects never reached calibration.
3. What WBPP did
The WBPP log (Weighted Batch Preprocessing 3.1.0, PixInsight 1.9.5) covers 128 calibration groups, 20 registration groups, 20 local-normalisation groups and the final integrations. By the log timestamps the whole run took about 43 minutes. The settings, as recorded in the log:
| Stage | What happened |
|---|---|
| Flats | Each group of flats (per filter and session) was calibrated with the master bias and integrated into a master flat: 39 master flats in total. Integration used Winsorized sigma clipping with multiplicative normalisation. |
| Light calibration | Every light frame was calibrated with the master dark matched automatically to its exposure time and the master flat for its filter and session. Light output pedestal: auto. No cosmetic correction appears in the log. Grouping was by filter, exposure, session and panel. |
| Reference frames | WBPP picked one best reference frame per panel, and in all four cases it was a 30 s R frame. All five filters of a panel are registered to that same frame, which is why the five masters of a panel line up with each other. |
| Registration | StarAlignment in Register/Match mode, automatic interpolation, no distortion correction. |
| Local normalisation | Local Normalization for every panel/filter group against its own reference (scale 752 px), producing the LN_Reference_Light_* files that stayed in the master folder. |
| Integration | ImageIntegration: average combination, Winsorized sigma clipping (σ low 3.42, σ high 2.73, cutoff 5), additive normalisation with scaling, local rejection normalisation, and PSF signal weighting. |
| Autocrop | The 20 masters were auto-cropped to the area covered by all frames of each panel: masterLight_BIN-1_3008x3008_EXPOSURE-…_FILTER-…_PANEL-n_autocrop.xisf. One example: 3008×3008 became 2915×2905 (crop window (26,41)x(2941,2946)). |
autocrop_backup/.4. Everything after WBPP, at a glance
| Stage | Folder | Key settings |
|---|---|---|
| SPFC + MGC | spfc_mgc/ | Gaia DR3/SP, MARS DR1, Astronomik curves, 6 nm H/O |
| BlurXTerminator | bxt_full/ | Defaults, Correct Only off |
| Registration | registered/ | One shared 5884×5884 canvas at 0.65″/px |
| Star masks | registered_masked/ | Black discs around border stars |
| Gradient merge | mosaic_final/ | GradientMergeMosaic, average, shrink 0, feather 10 |
| Crop | mosaic_final_cropped/ | 5288×5376, same crop for all five |
| Masters | masters/ | RGB.xisf, H.xisf, O.xisf |
| Final merge | matrix2/v2/ | NXT on linear HOO and RGB, 30 % RGB blend, sky 0.125, hot pixels fixed, stars screened on (see sections 14–17) |
5. SPFC and MGC
Spectrophotometric Flux Calibration compares the measured star fluxes in each panel against Gaia DR3/SP spectra, so it needs to know what each filter and the sensor actually pass. For the broadband panels I used the built-in Astronomik Deep Sky R/G/B transmission curves and the Sony IMX533 quantum-efficiency curve. For Hα and OIII I used narrowband mode with the exact centre wavelengths (656.30 and 500.70 nm) and a 6 nm bandwidth.
Straight after SPFC, each image went through MultiscaleGradientCorrection with the MARS DR1 database and the MARS filter matching the data: R, G, B, Hα, OIII. Because the camera is mono, each file is treated as a single gray channel with its own filter.
6. BlurXTerminator, full
The earlier Correct Only pass fixed the optics; this second pass is the full deconvolution with default settings (sharpen stars 0.50, sharpen non-stellar 0.50, automatic PSF). One trap for scripters: the process’s own scripted default has correct_only = true, so it must be switched off explicitly or you silently get another Correct Only run.
7. Registration onto one canvas
All the panels were already plate-solved, so instead of matching stars I reprojected every image with the engine behind the MosaicByCoordinates script. The important detail is that all 20 images went through a single run, so the output canvas, scale and rotation are computed once and are identical for every filter: 5884×5884 px at 0.65″/px. Each image is placed on that canvas in its own file, and the five filters overlay pixel for pixel.
A first GradientMergeMosaic run on these tiles produced five mosaics that looked seamless at a glance. Zooming in told another story.
8. The bright-star border problem
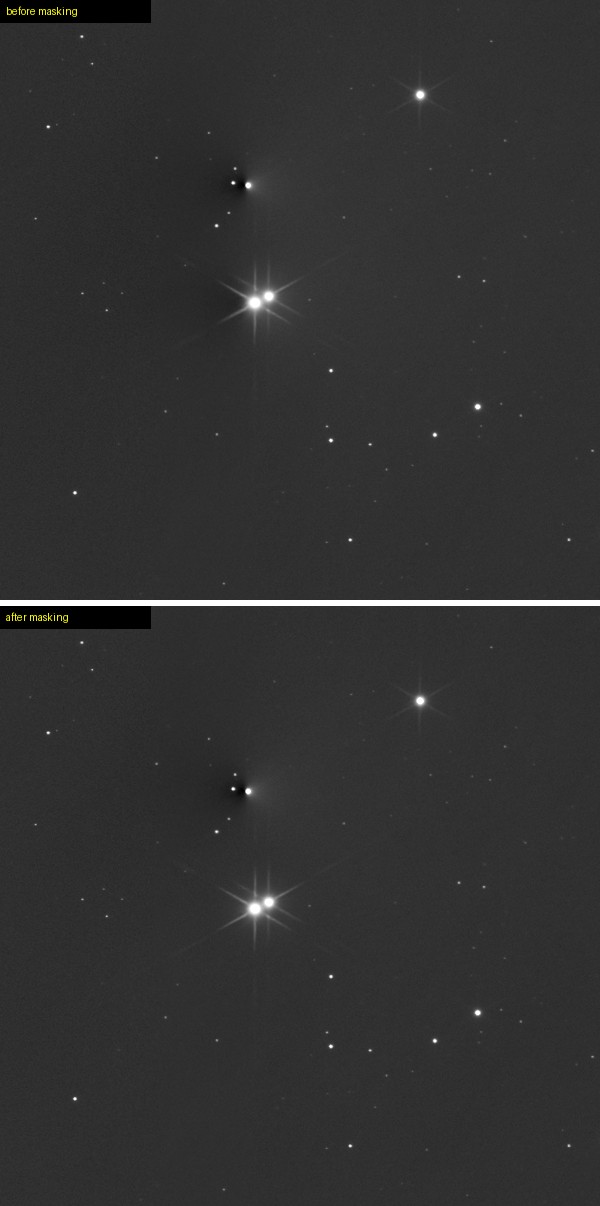
In the first mosaics, bright stars at the edge of a panel had left dark holes, dark shadows and one-sided bright smears. The cause is simple once you see the data: at one join, Panel 1 ended right through a bright star’s core, while Panel 2 held the whole star about 100 px inside its own edge. The merge algorithm works on image gradients, and a star truncated by a tile edge is a violent gradient step.
The fix, in three steps
- Scan every tile edge. Bright stars were detected on the union of all tiles, with a threshold scaled to brightness, and each star’s halo disc was tested against every tile’s valid region. The scan found 55 locations across the five filters where an edge cuts through a bright star’s halo. An early version with a fixed brightness cutoff missed fainter stars, so the threshold had to come down.
- Fill with black. Where a neighbouring panel contains the whole star, the clipped copy gets a black disc (radius roughly 60–80 px, scaled to the star’s brightness). Zero counts as “no data” to the merge, so the clean copy fills in. This is the same idea as eroding the tile edge, but over a much larger area than the merge’s own 1 px edge shrink.
- Shrink the edge by 0 px. A second, separate artifact looked like a dark wedge at the left edge between two panels. There was no star there at all: the two panels overlap by only 6–18 px, and the default one-pixel edge shrink erodes that strip away at the corner.
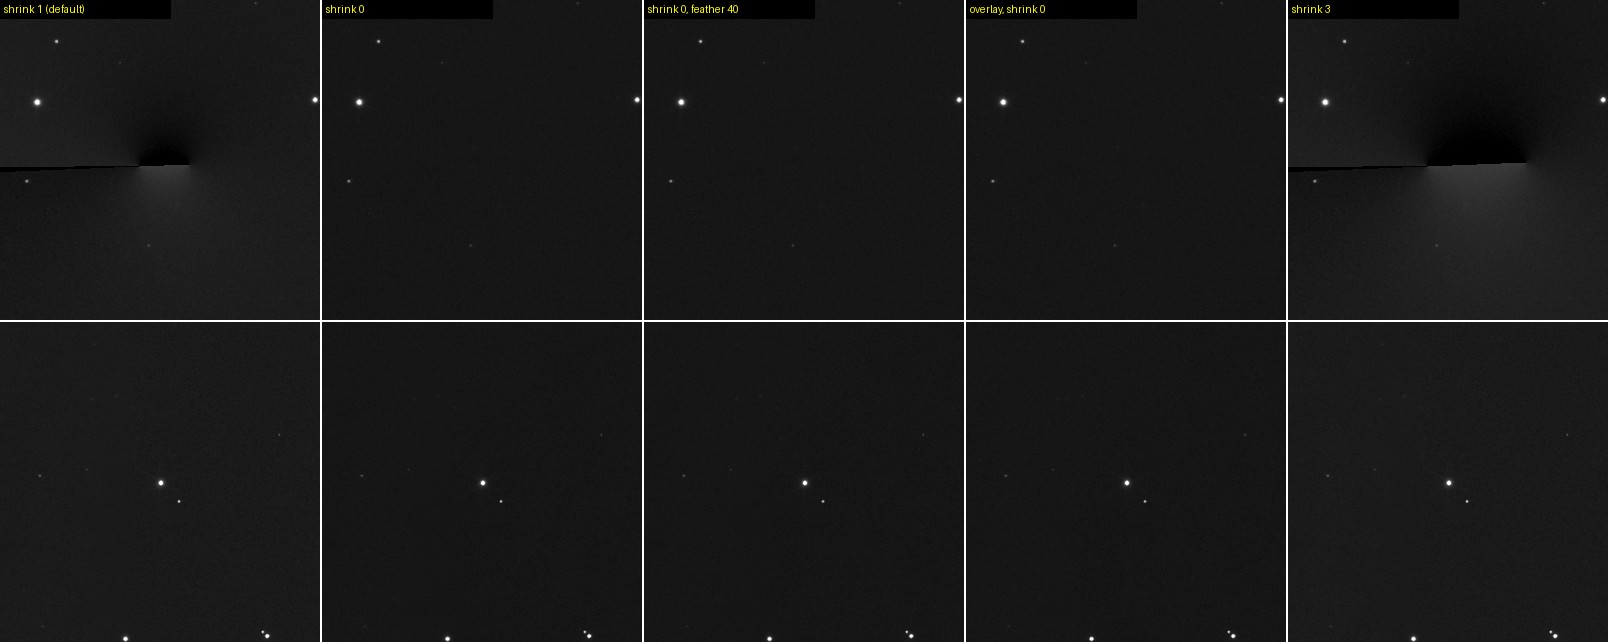
I then compared the final result at ten different star locations on the B mosaic (the pair at the join, the left-edge wedge and several other panel joins), and the corners of the R and B mosaics. All were clean. I checked six locations on R and ten on B; G, H and O use exactly the same recipe, but I looked at them at lower magnification only.
9. Final mosaics and crop
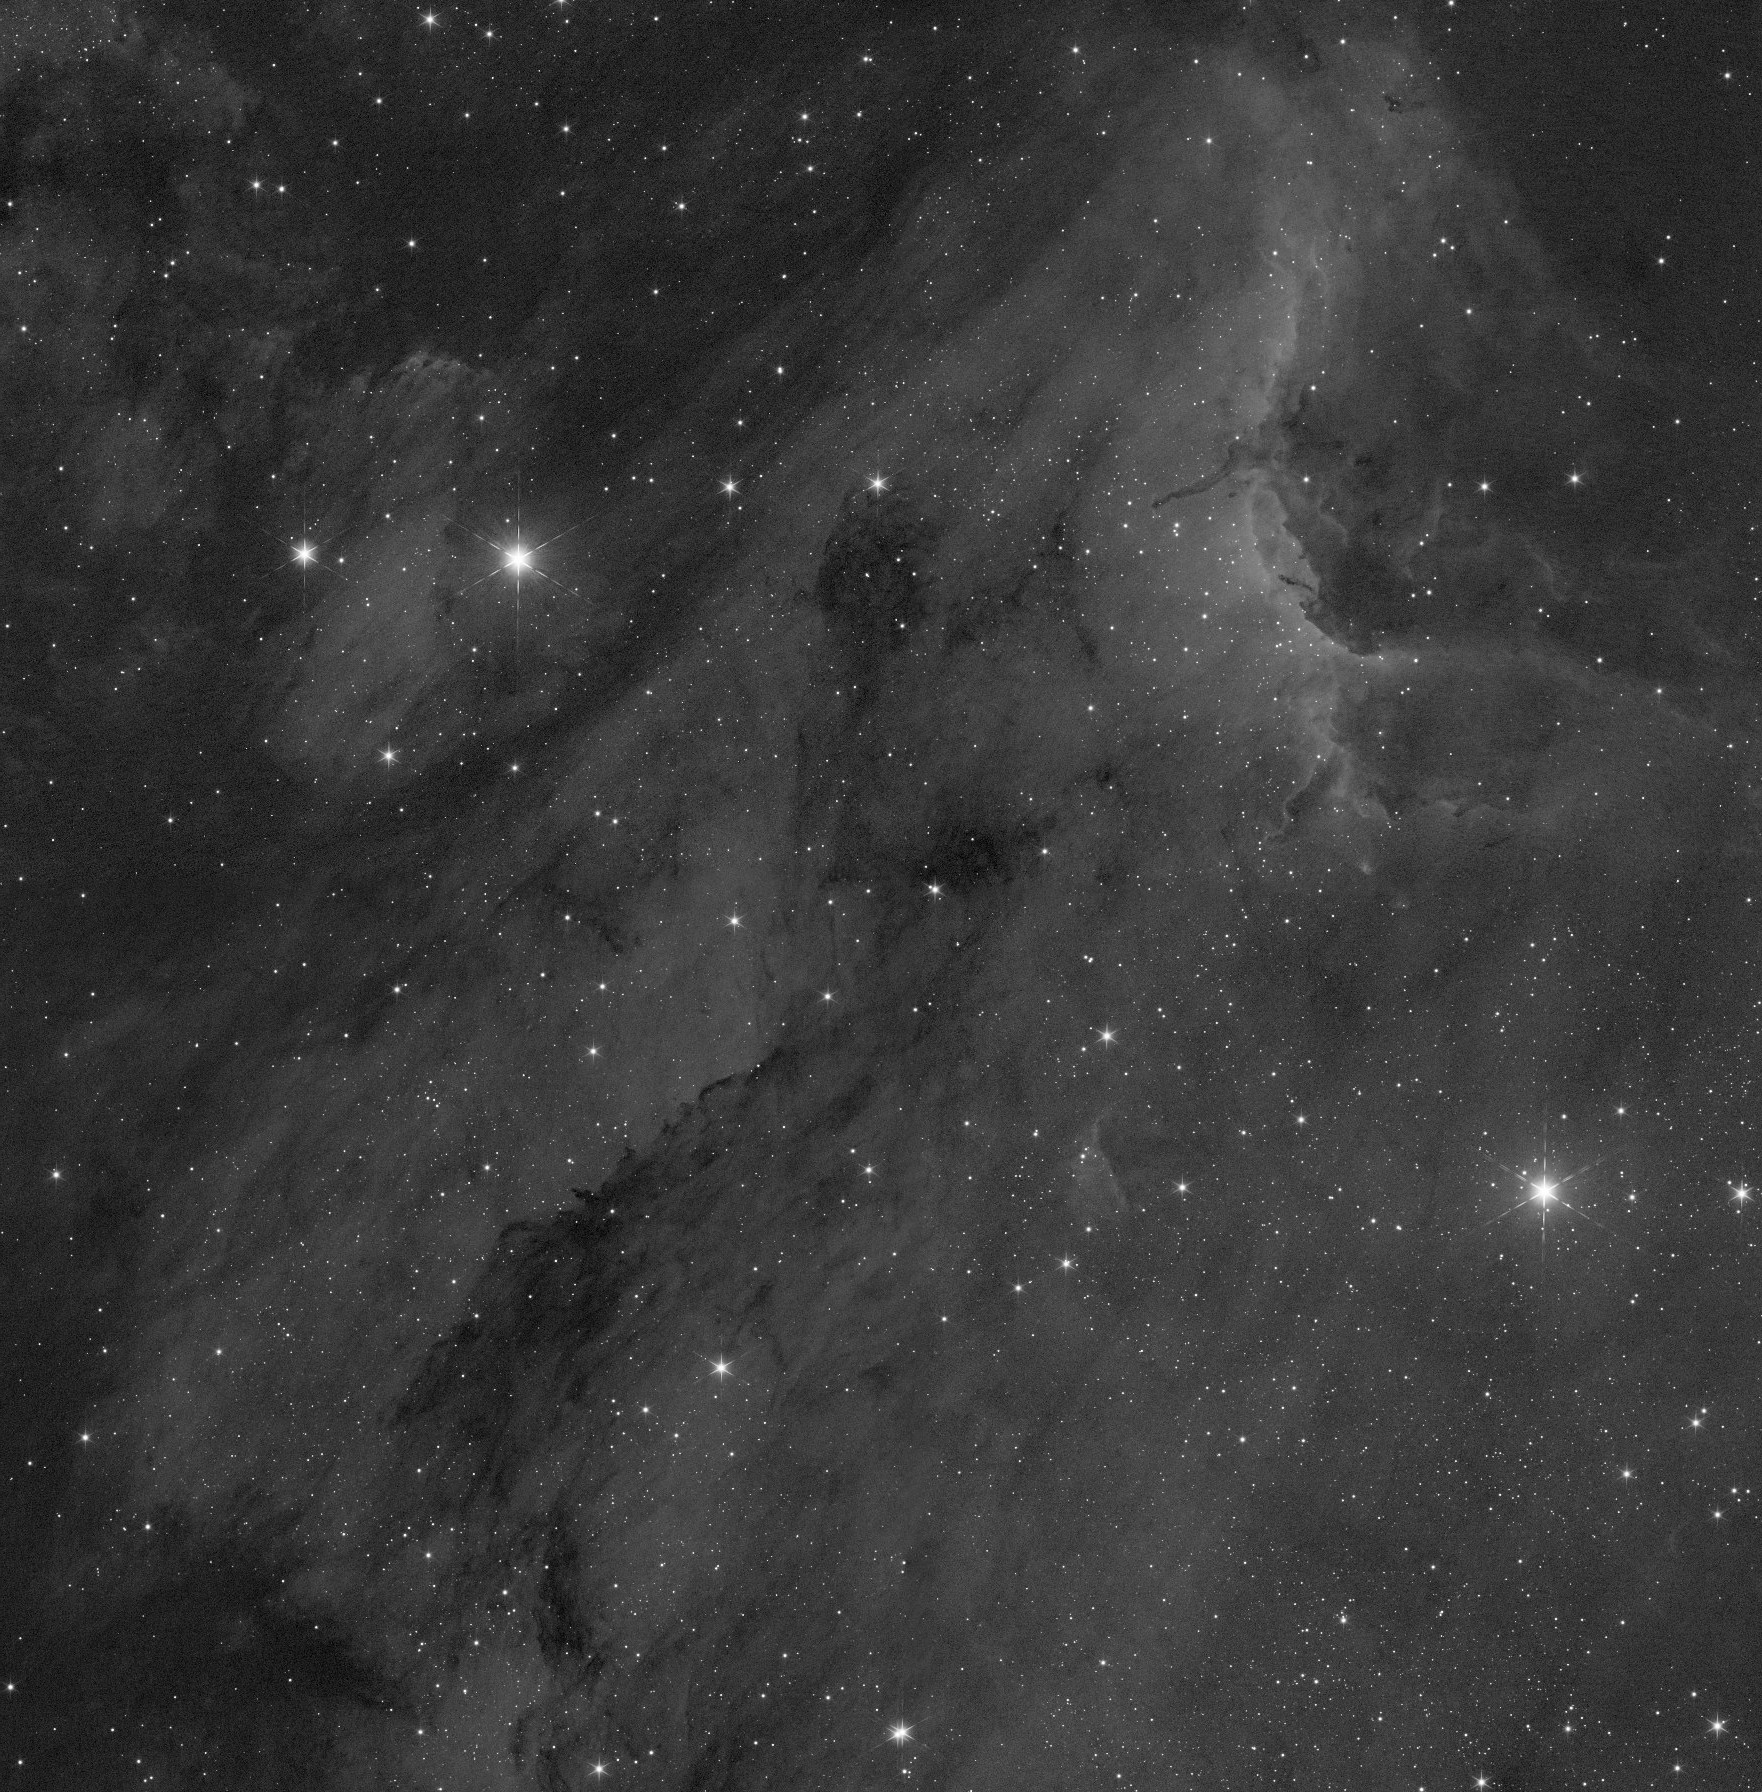
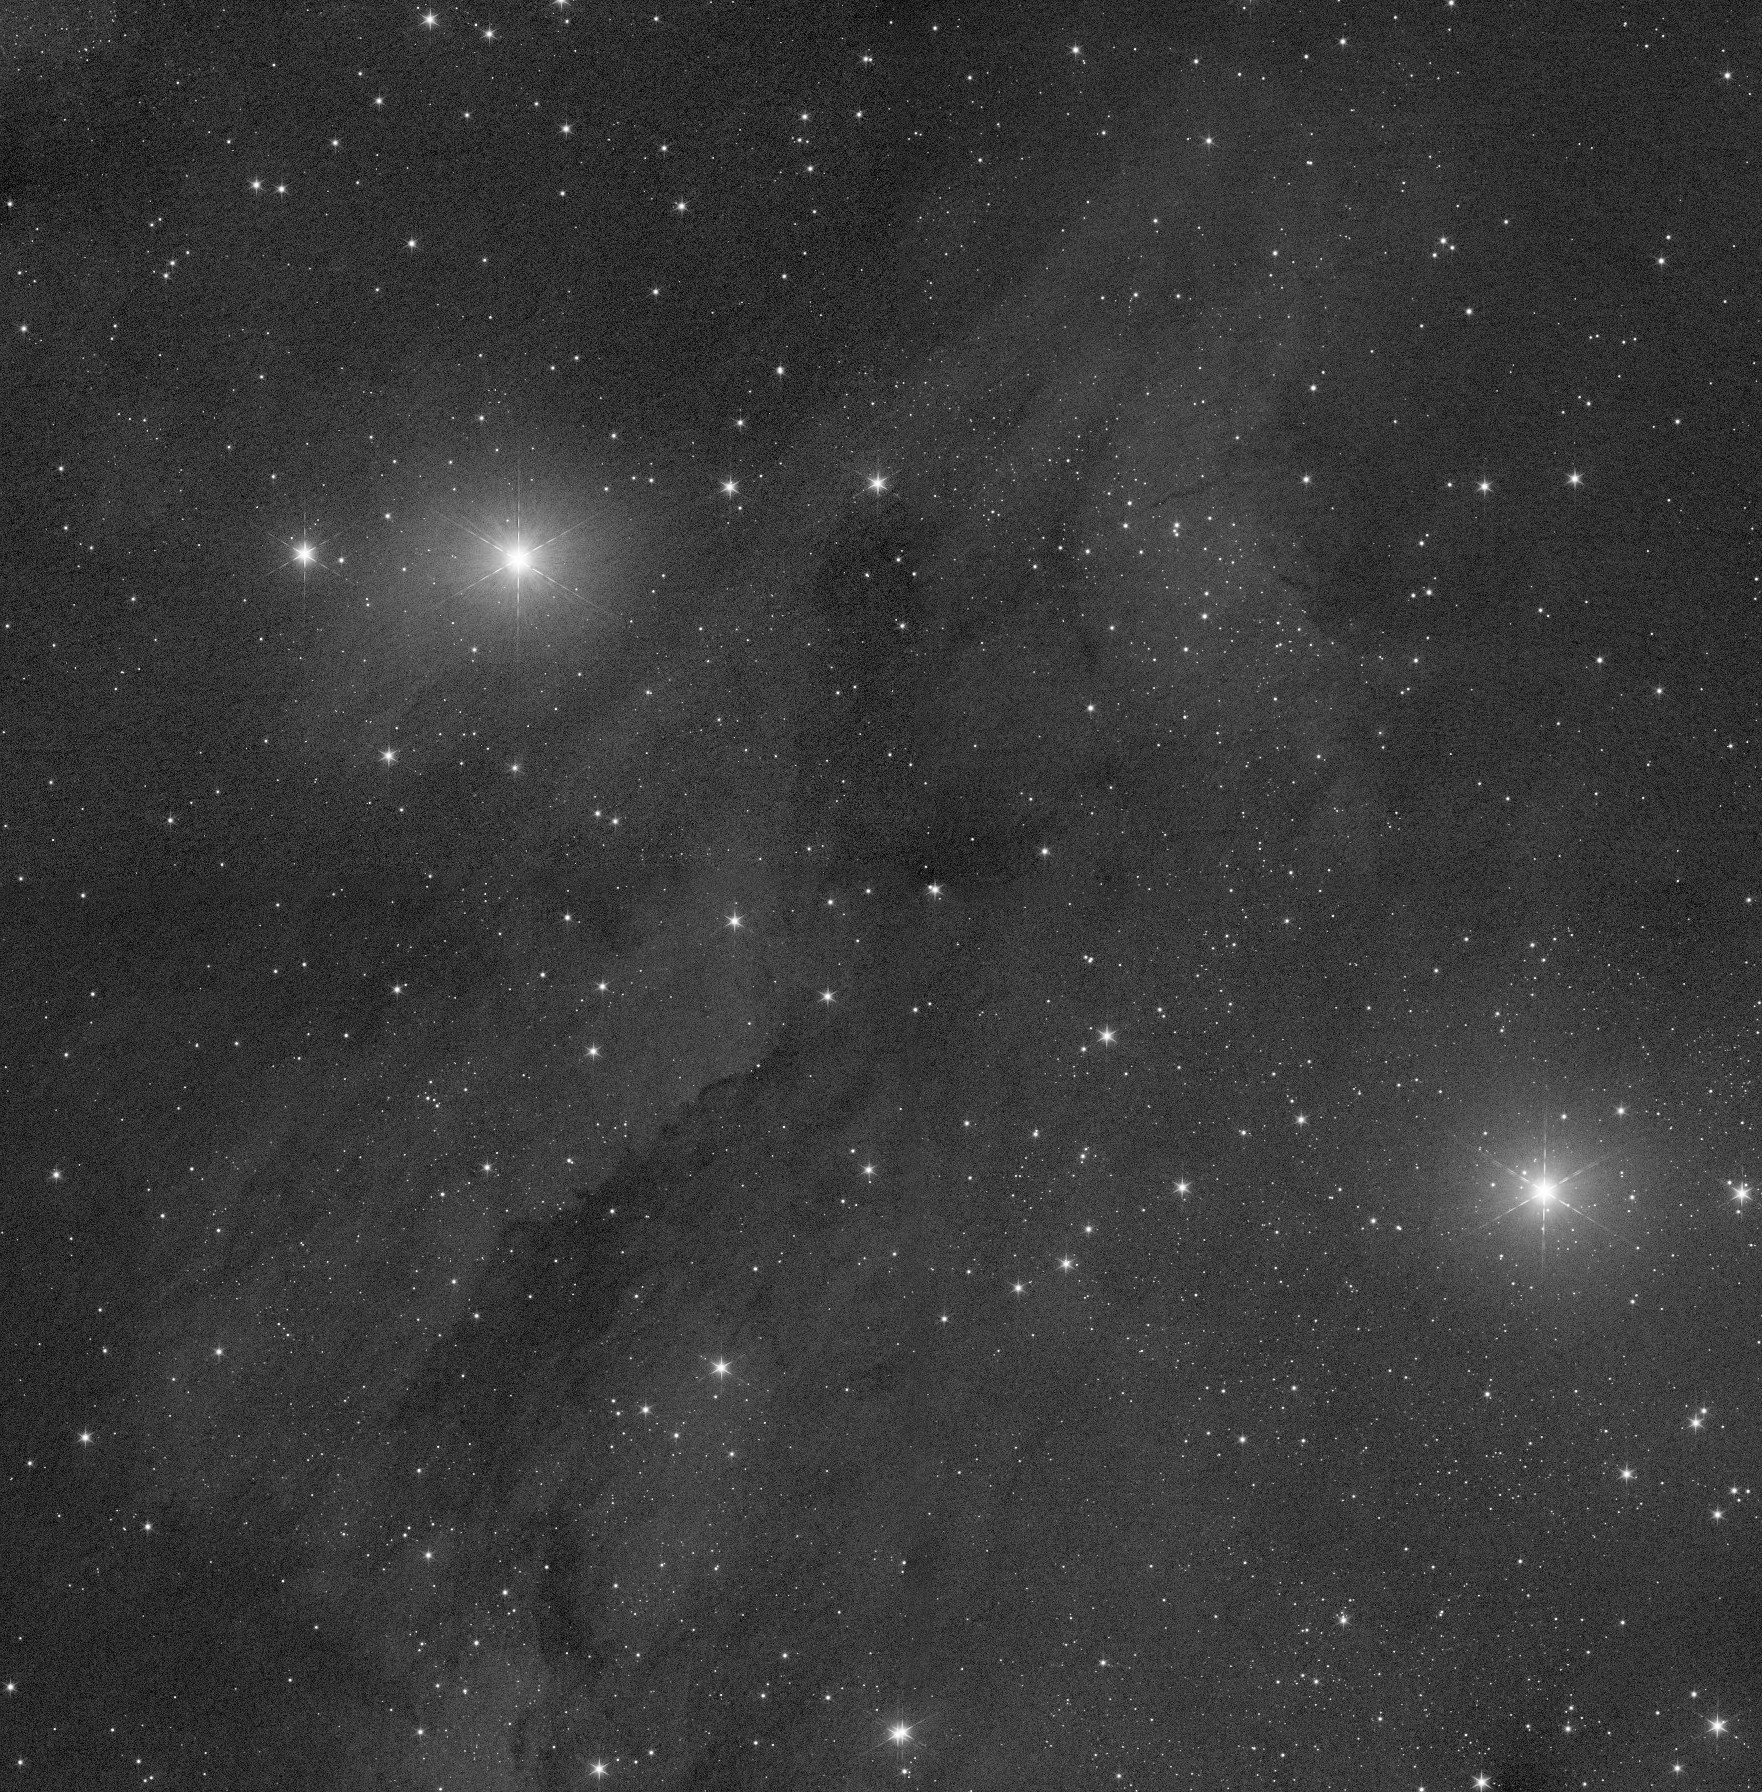
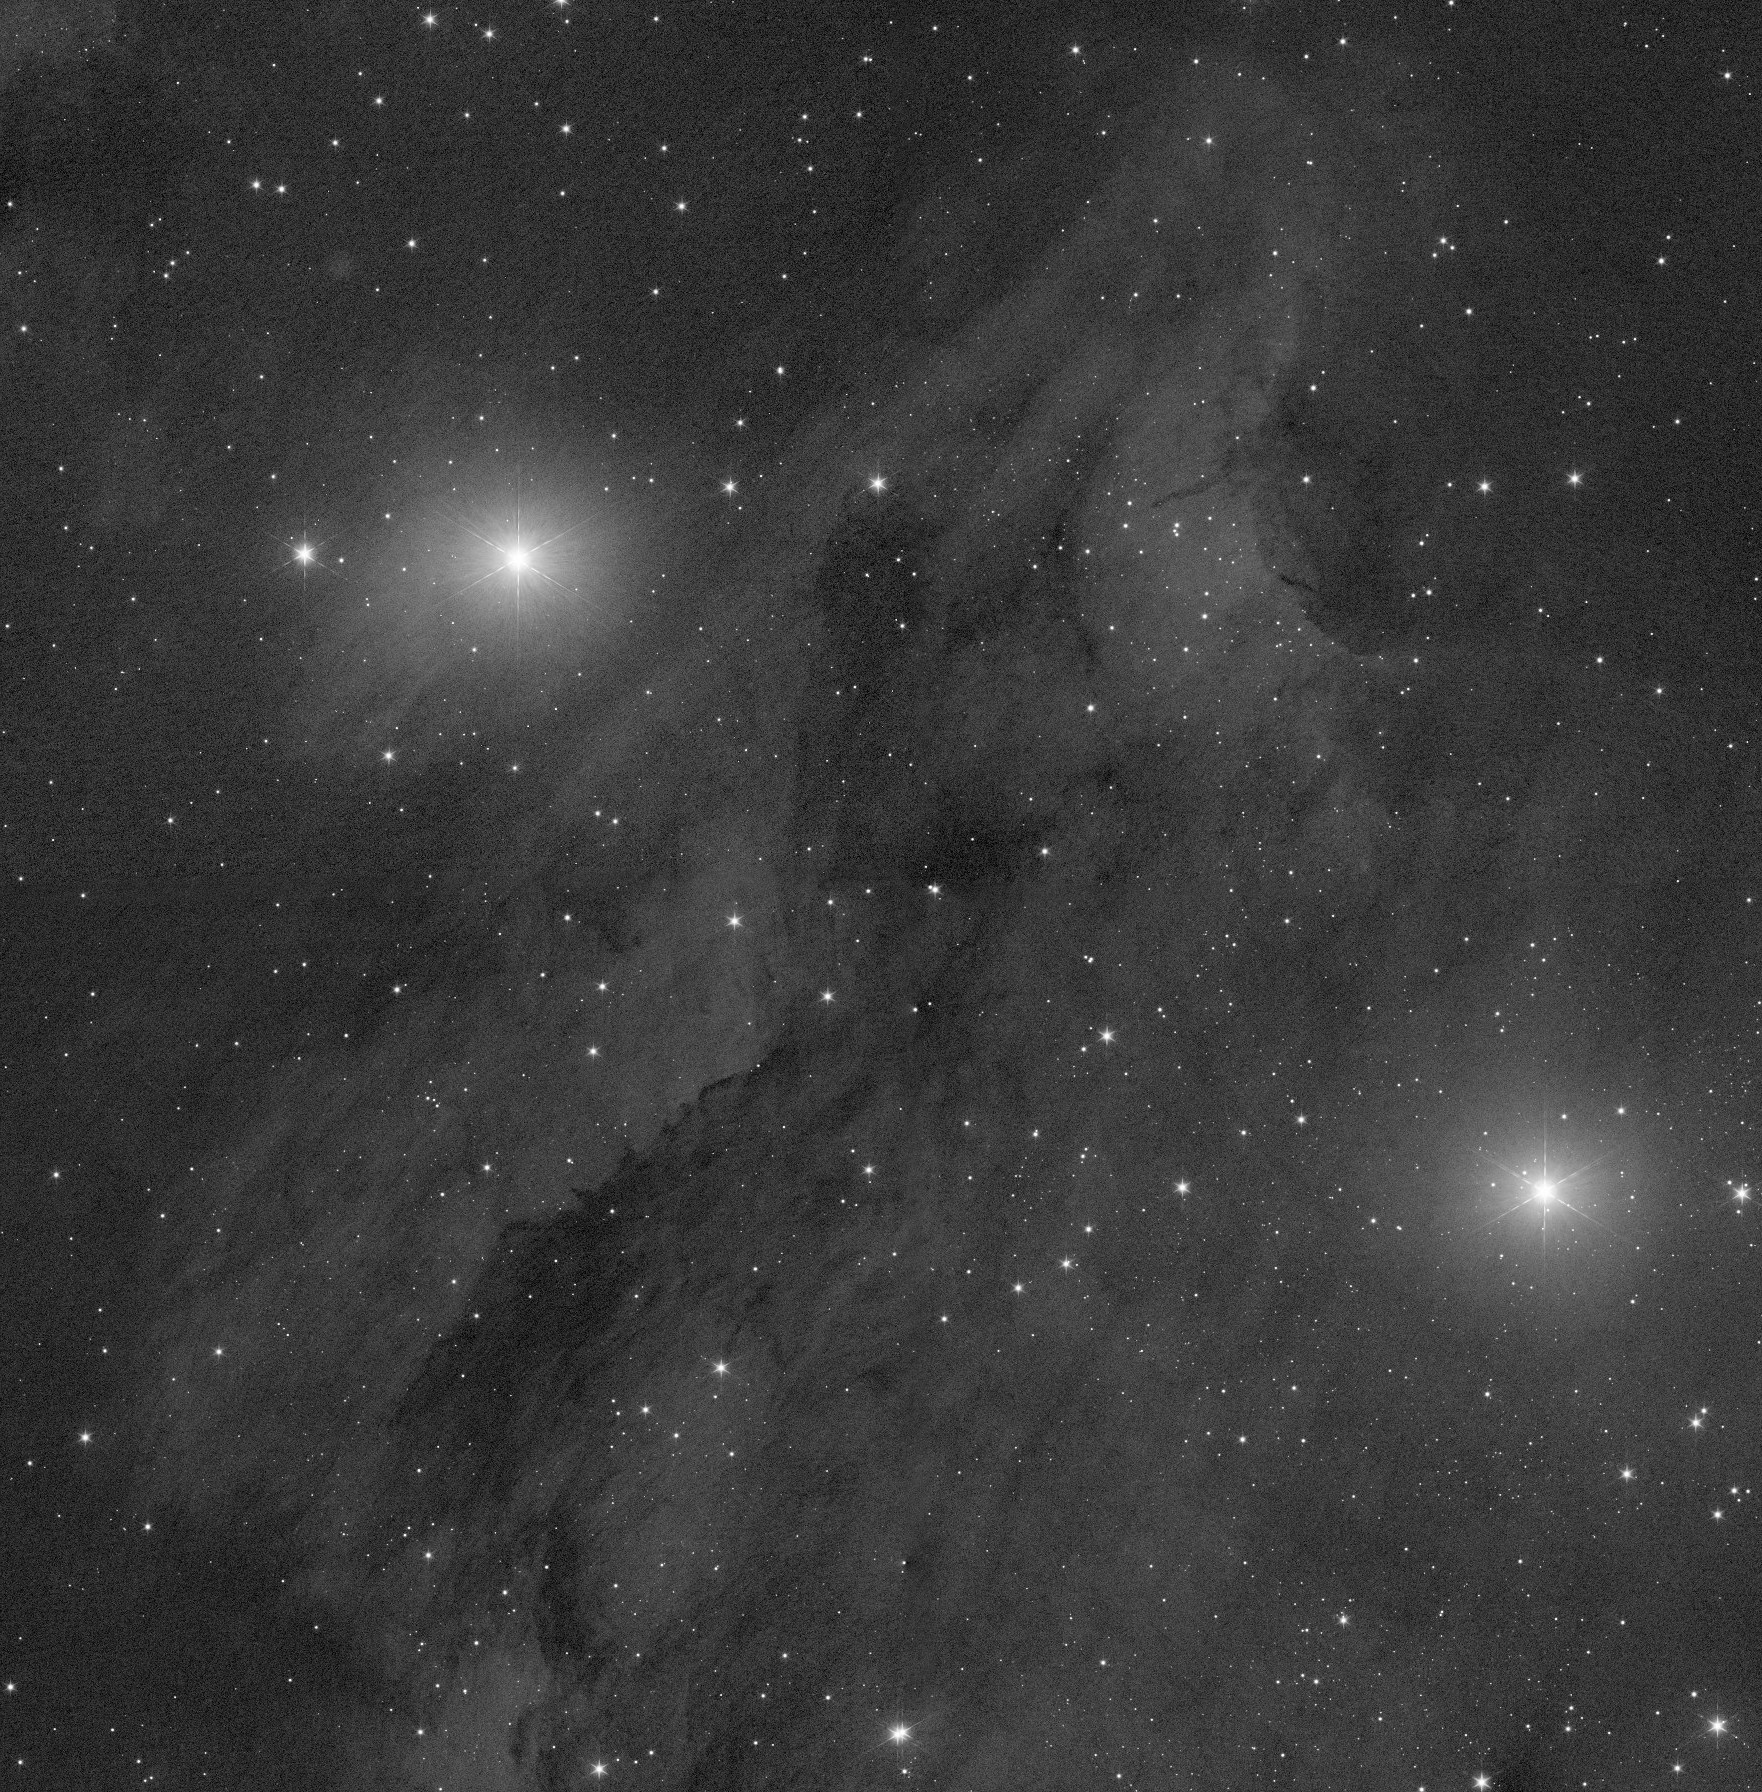
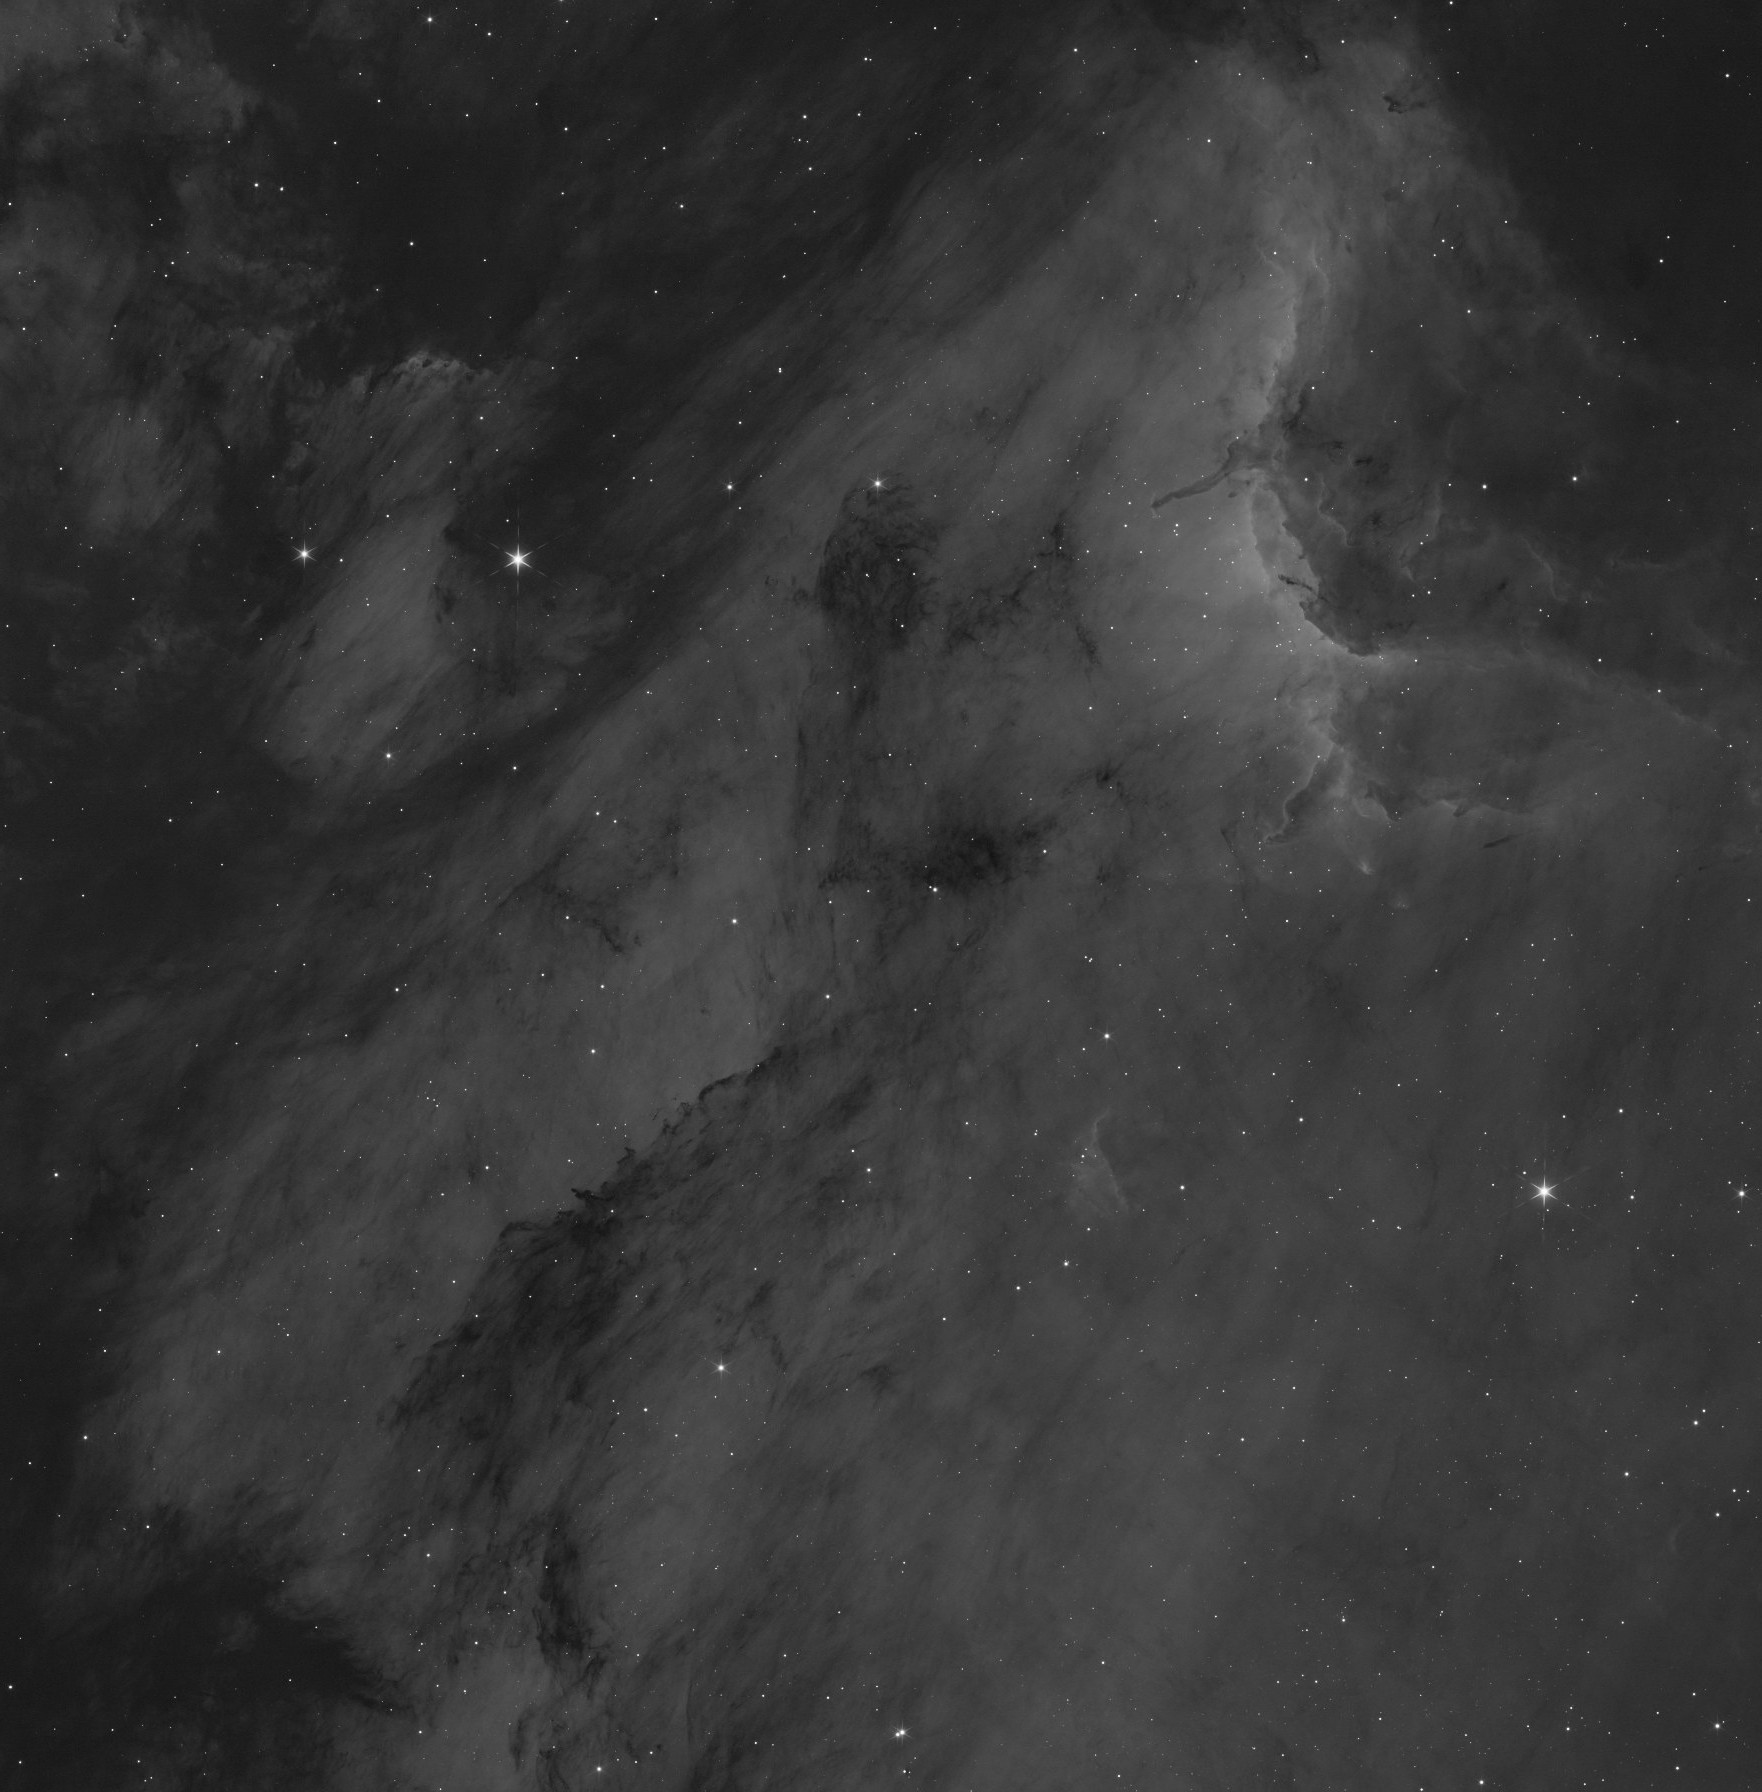
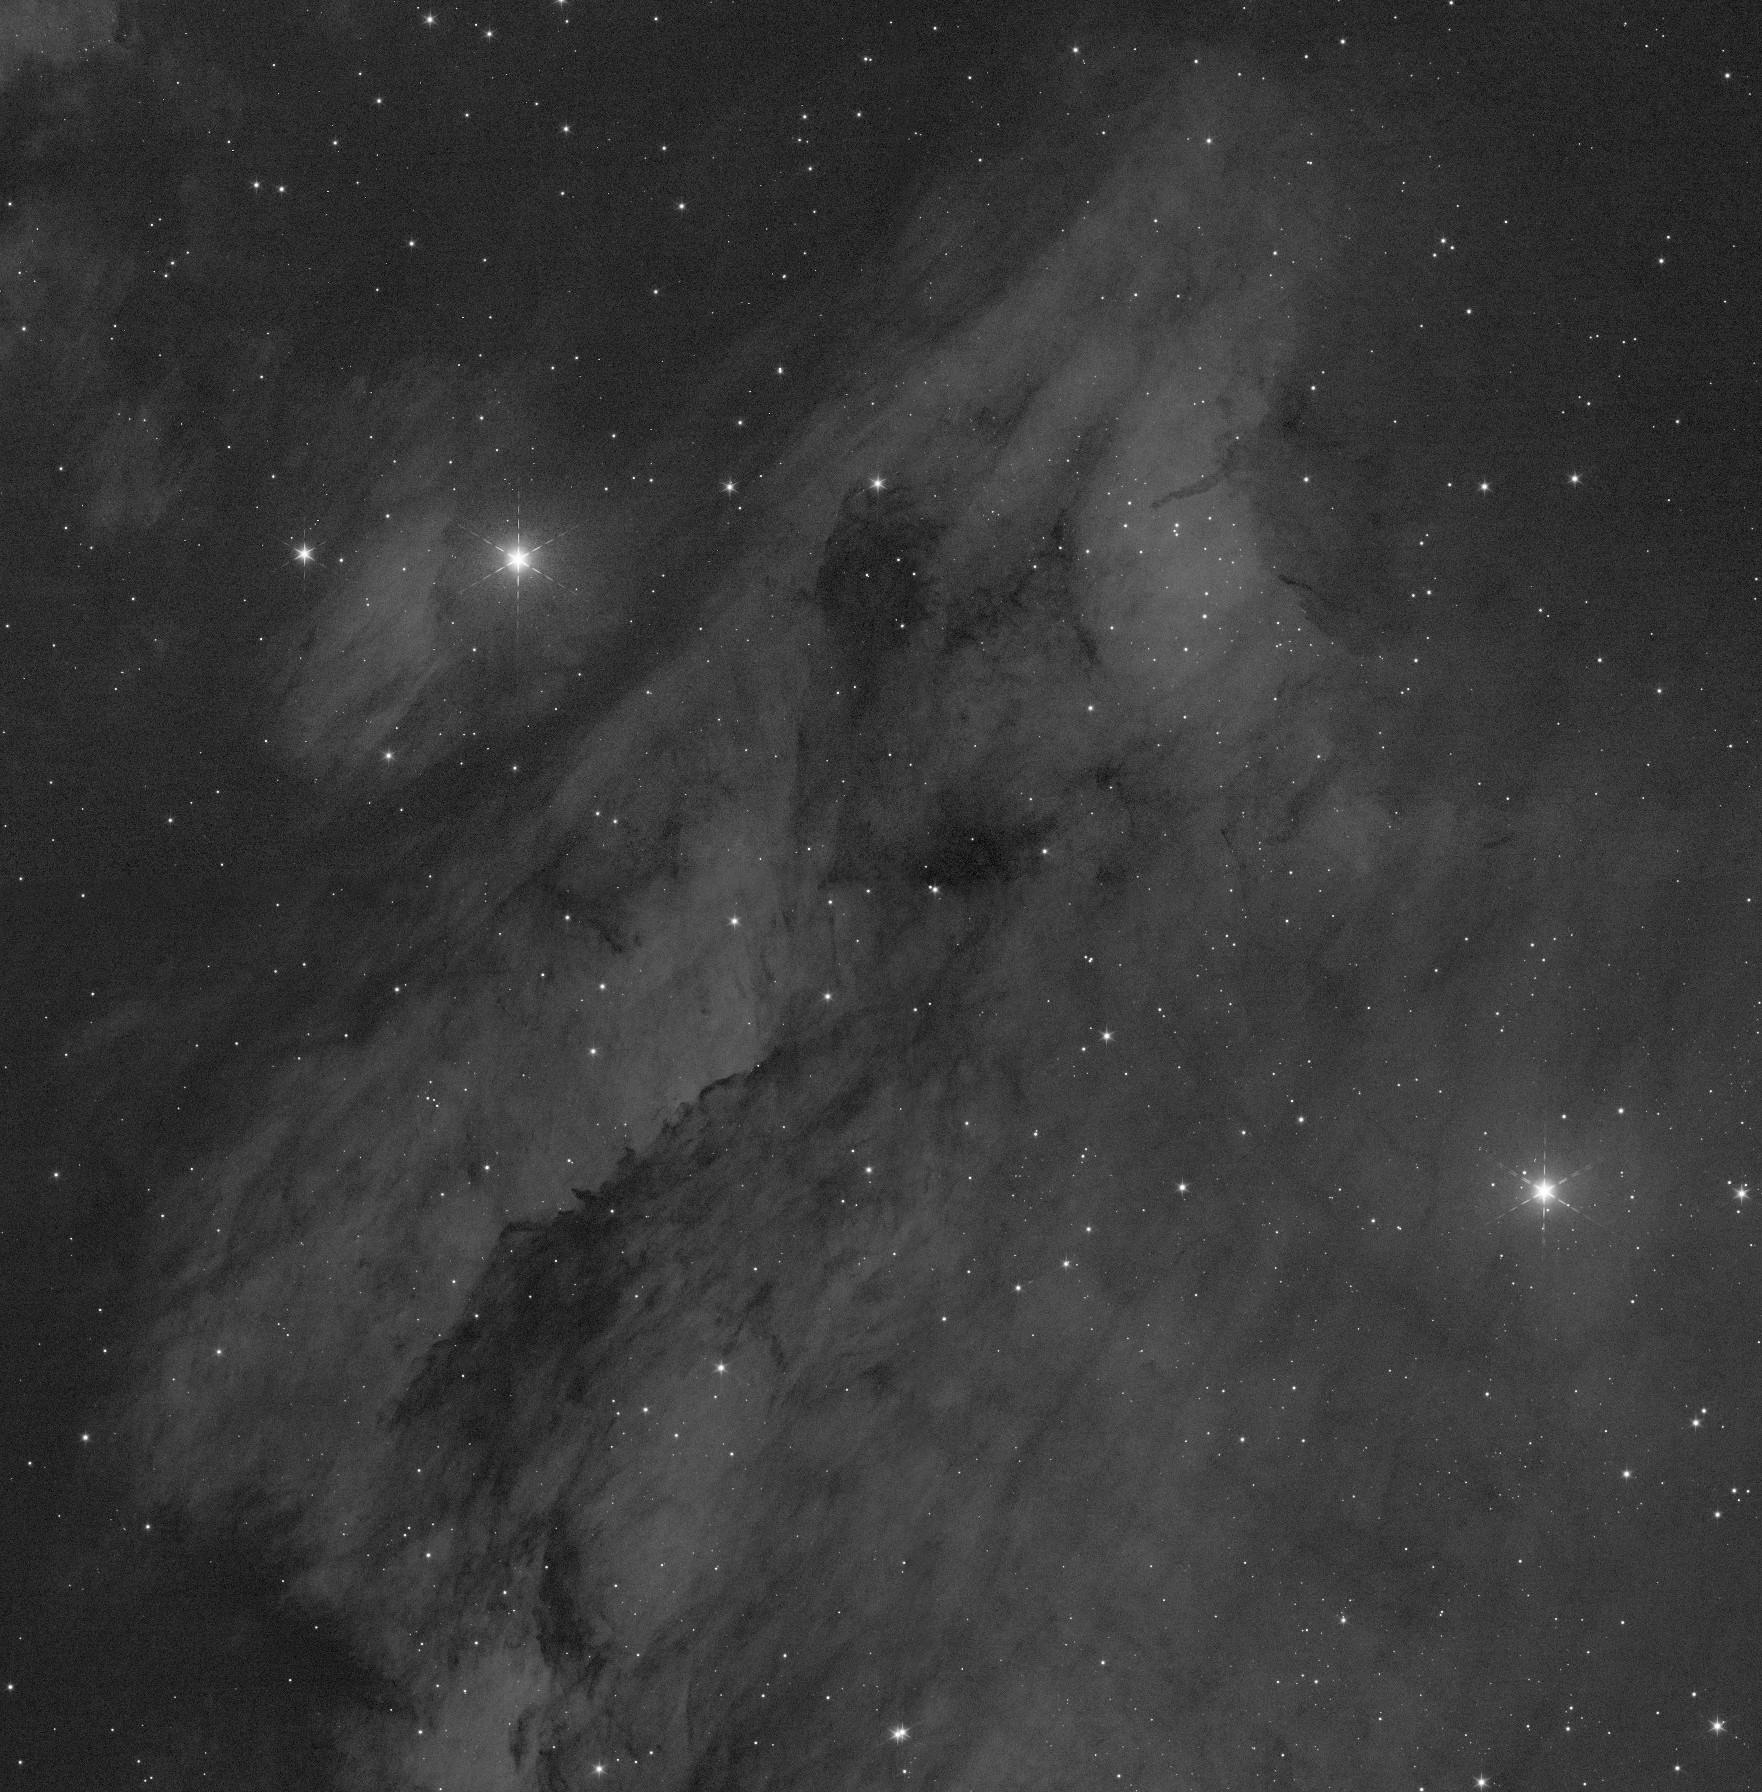
Stars on the outer border of the mosaic have no neighbouring panel to take over, so they cannot be masked. Instead, all five mosaics were cropped to one common rectangle that lies at least 160 px inside the valid data everywhere, which removed every outer-border star on the list. The crop is x 376–5664, y 224–5600, leaving 5288×5376 px, with no pixels at or near zero left in any of the five.
10. RGB, H and O masters
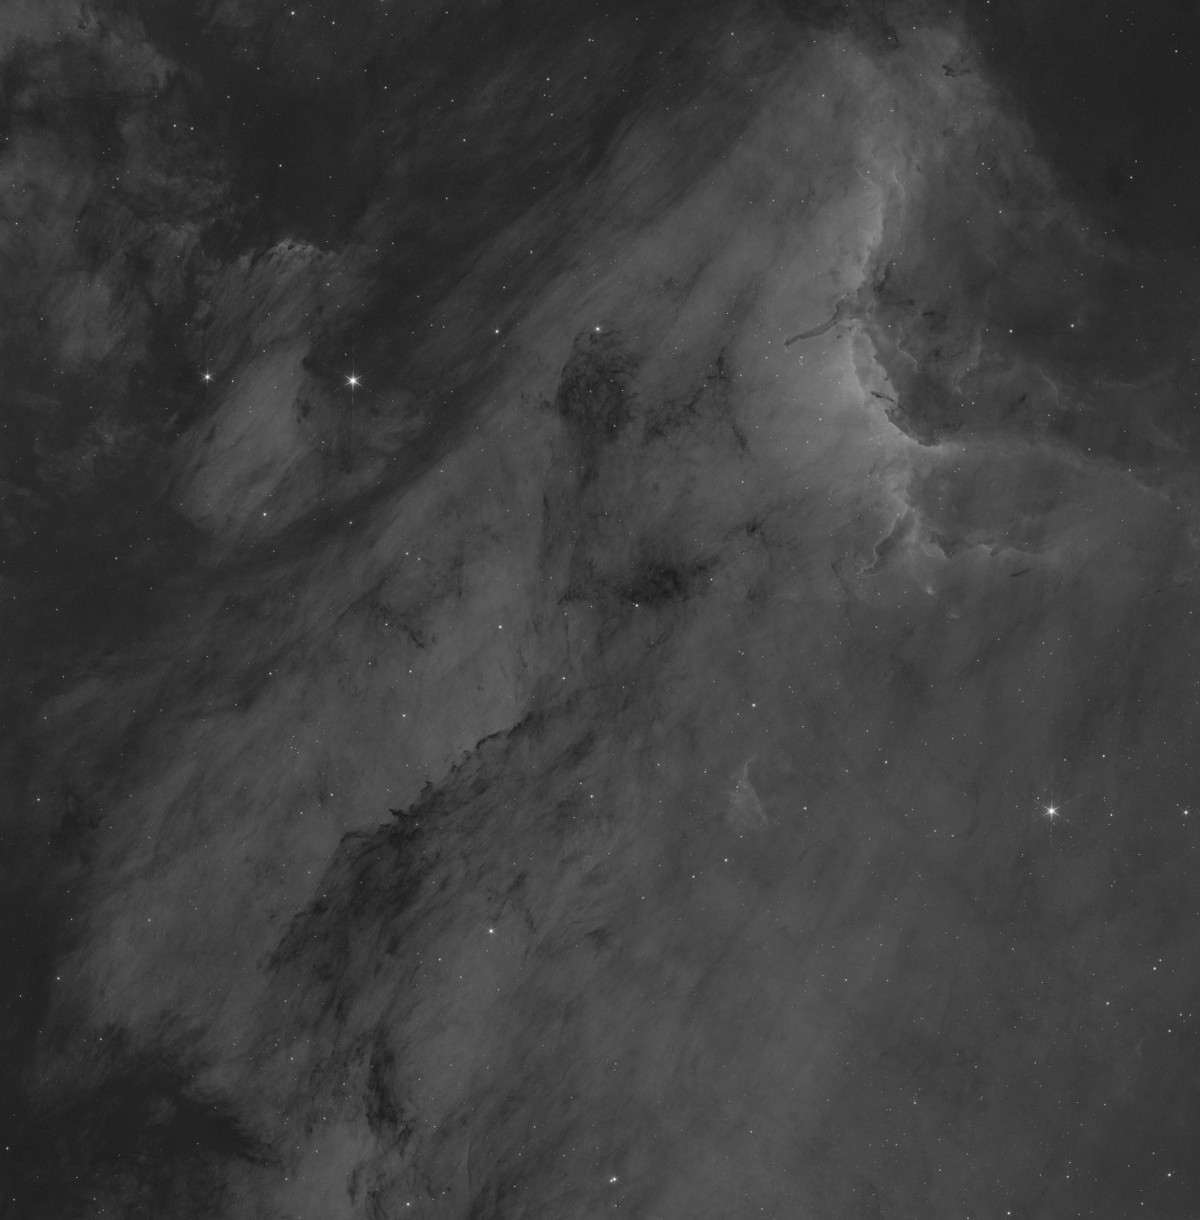
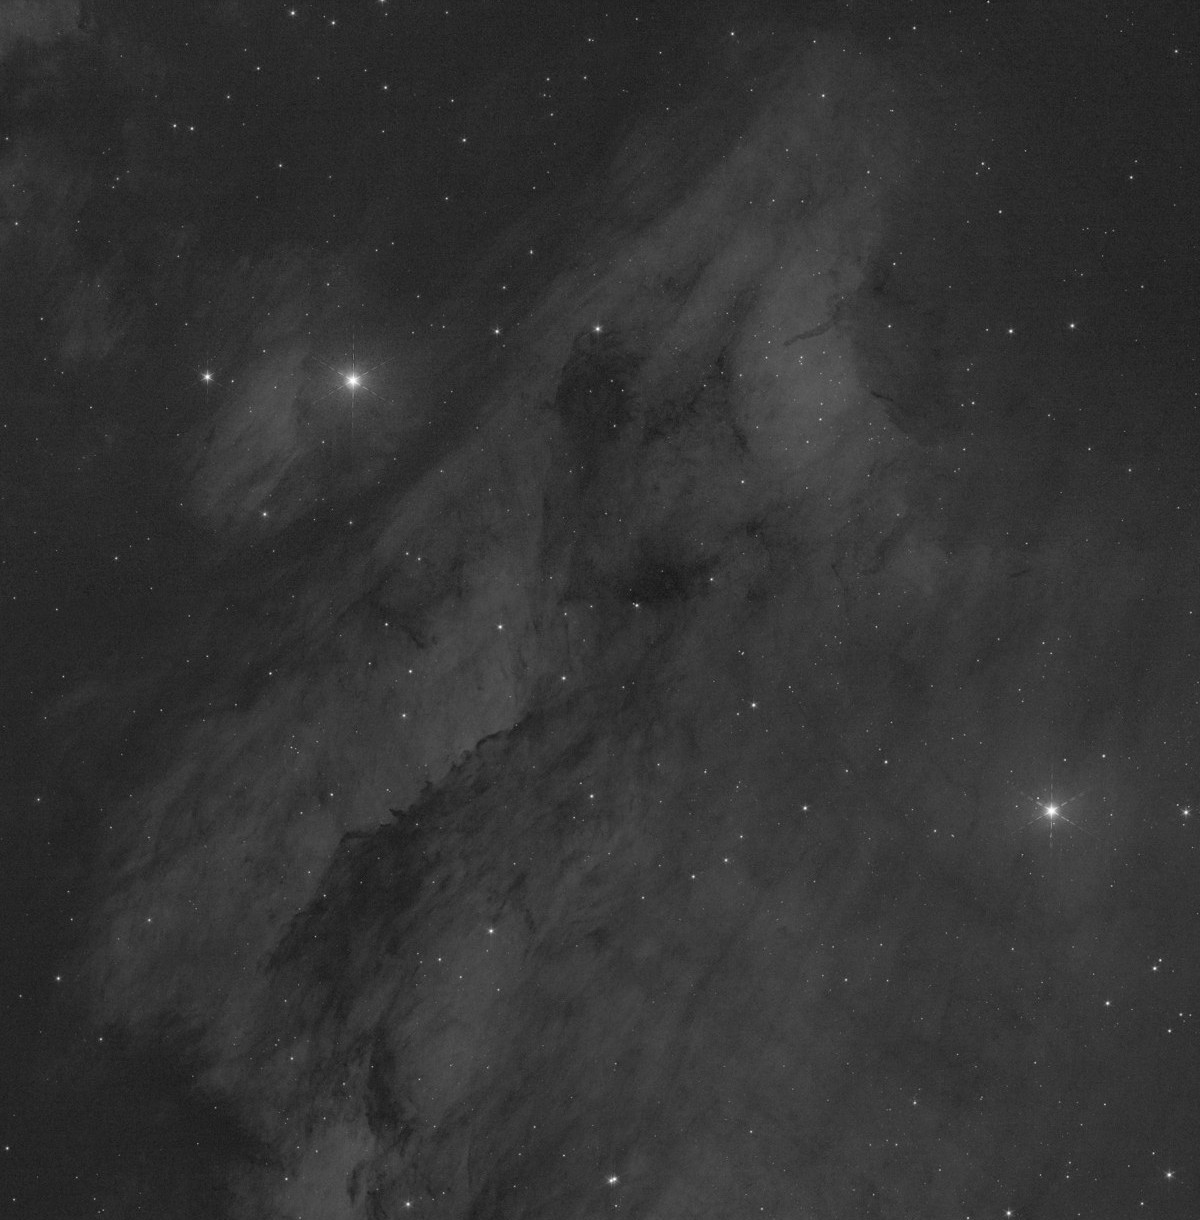
The next steps were done by hand in the PixInsight GUI on the cropped mosaics: RGB combination, a default BlurXTerminator pass, a plate solve (the mosaic had no astrometric solution of its own, and cropping drops any that exists), and SpectroPhotometric Color Calibration. The results are saved in output/masters/ as RGB.xisf, H.xisf and O.xisf (the last two with BlurXTerminator applied), all 5288×5376 px. These are ready for further integration.
11. Two paths that meet again
From here the data naturally splits in two. The broadband channels carry the colour and the star shapes; the narrowband channels carry the faint nebular detail. They are best processed separately and only joined late, once each has been brought to a comparable state. Below is the plan from this point; the first attempts at all three merge options are kept at the end of this post, under Paths not taken, since the real iterative work picks up again right after this plan.
Path A · broadband RGB
- R + G + B combined, BlurXTerminator, plate solve, SPCC done
- Check for residual gradients and colour casts
- Linear noise reduction
- Split stars from background (starless + stars)
- Stretch the starless image
Path B · narrowband Hα and OIII
- BlurXTerminator on each done
- Continuum-subtract: remove the broadband light that is also in the narrowband
- Linear noise reduction
- Split stars from background
- Balance the two against each other, stretch each starless image
Why the two paths can be combined so easily
RGB, H and O are all exactly 5288×5376 px on the same canvas and the same crop, because every filter went through one registration run. No further alignment is needed; a quick blink of the three is enough to confirm it. Also, the narrowband data are much deeper than the broadband data: about 7.5 h of Hα and 7.2 h of OIII against about 2.5 h per colour channel. That is the argument for letting the narrowband provide the detail and the broadband provide colour and stars.
An overlap to handle first
The Astronomik R filter passes the 656 nm Hα line, and the G filter passes most of the 501 nm OIII line. If Hα is simply added to the red channel, the nebula’s red light is counted twice and the stars get boosted too. The fix is continuum subtraction: scale the broadband channel to the narrowband one using the stars (which are in both) and subtract it, leaving only the pure emission. PixInsight ships a ContinuumSubtraction script and an NBRGBCombination script for this kind of work, along with NBtoRGBStars.
Three ways to merge, and what I would pick
| Option | How | Good for | Watch out for |
|---|---|---|---|
| 1. Boost the RGB channels | In linear data: R′ = R + a·Hαcs, G′ = G + b·Ocs, B′ = B + c·Ocs, then stretch | Natural colour, stars stay as they are | Needs good continuum subtraction; do not re-run SPCC afterwards, it would undo the boost |
| 2. Bicolour starless blend | Starless Hα → red, starless OIII → green and blue (“HOO”), then blended with the starless RGB | Maximum nebula contrast and detail | Colours are false and Hα-dominant; OIII is weak here, so it must be scaled up to show |
| 3. Narrowband as luminance | Use Hα (or an Hα+OIII mix) as the lightness of the RGB | Cleanest detail and noise | Colour can look washed out or shifted; the deep Hα tends to dominate |
- Make the starless / stars split for all three images (RGB, Hα, OIII) while still linear, using StarXTerminator or StarNet2. The G and B previews above show noticeably fatter star halos than R, so keeping the RGB stars separate also lets them be treated on their own.
- Build the nebula from option 1 first (the natural-colour version), with continuum-subtracted Hα and OIII, and option 2 (the HOO starless version) as a contrast layer.
- Stretch the starless nebula images individually (Generalized Hyperbolic Stretch or the arcsinh stretch), matching their backgrounds, then blend with PixelMath or a mask: roughly “RGB nebula, strengthened with HOO where the narrowband signal is strong”, with weights chosen by eye.
- Add the RGB stars back on top with a screen blend,
~((~starless) * (~stars)), after stretching the stars lightly so they stay small and keep their colour. - Finish with saturation and contrast curves, light noise reduction on the starless layer, and a final check at 100 % along the old panel seams.
The blending weights, the stretch and the colour choices are artistic decisions, so those will be done by eye in PixInsight. The mechanical parts are another matter: the star removal, the continuum subtraction and the scaling of the channels to a common level can be scripted and run in a batch like the earlier stages, which makes it quick to try several variants. The first attempt at each option is kept at the end of this post, under Paths not taken; the weights and the choice of option were still a starting point there. The next section picks up the real work.
12. Second round: the way I usually do it
The first drafts (kept at the end of this post, under Paths not taken) were stretched too hard: the black was black, and no sky is that black. For the second round I changed two things, and both come from how I normally work in PixInsight.
- A gentle stretch with the sky at about 0.15. Each narrowband image is stretched only as far as needed, with the dark areas lifted to a background of 0.15 instead of being clipped to black.
- Stars stretched by the same amount as the RGB image. I auto-stretch the linear RGB in PixInsight, note the settings, and go back to the linear image. StarXTerminator then splits off the stars, and that stars image is stretched with exactly those settings. Here that was a linked auto-stretch with shadows at 0.000387 and midtones at 0.00034, the amount STF gives this RGB (median 0.0005). The stars are merged into the nebula image afterwards with a screen blend.
Option 2 again: HOO, gently stretched, with a few star variants
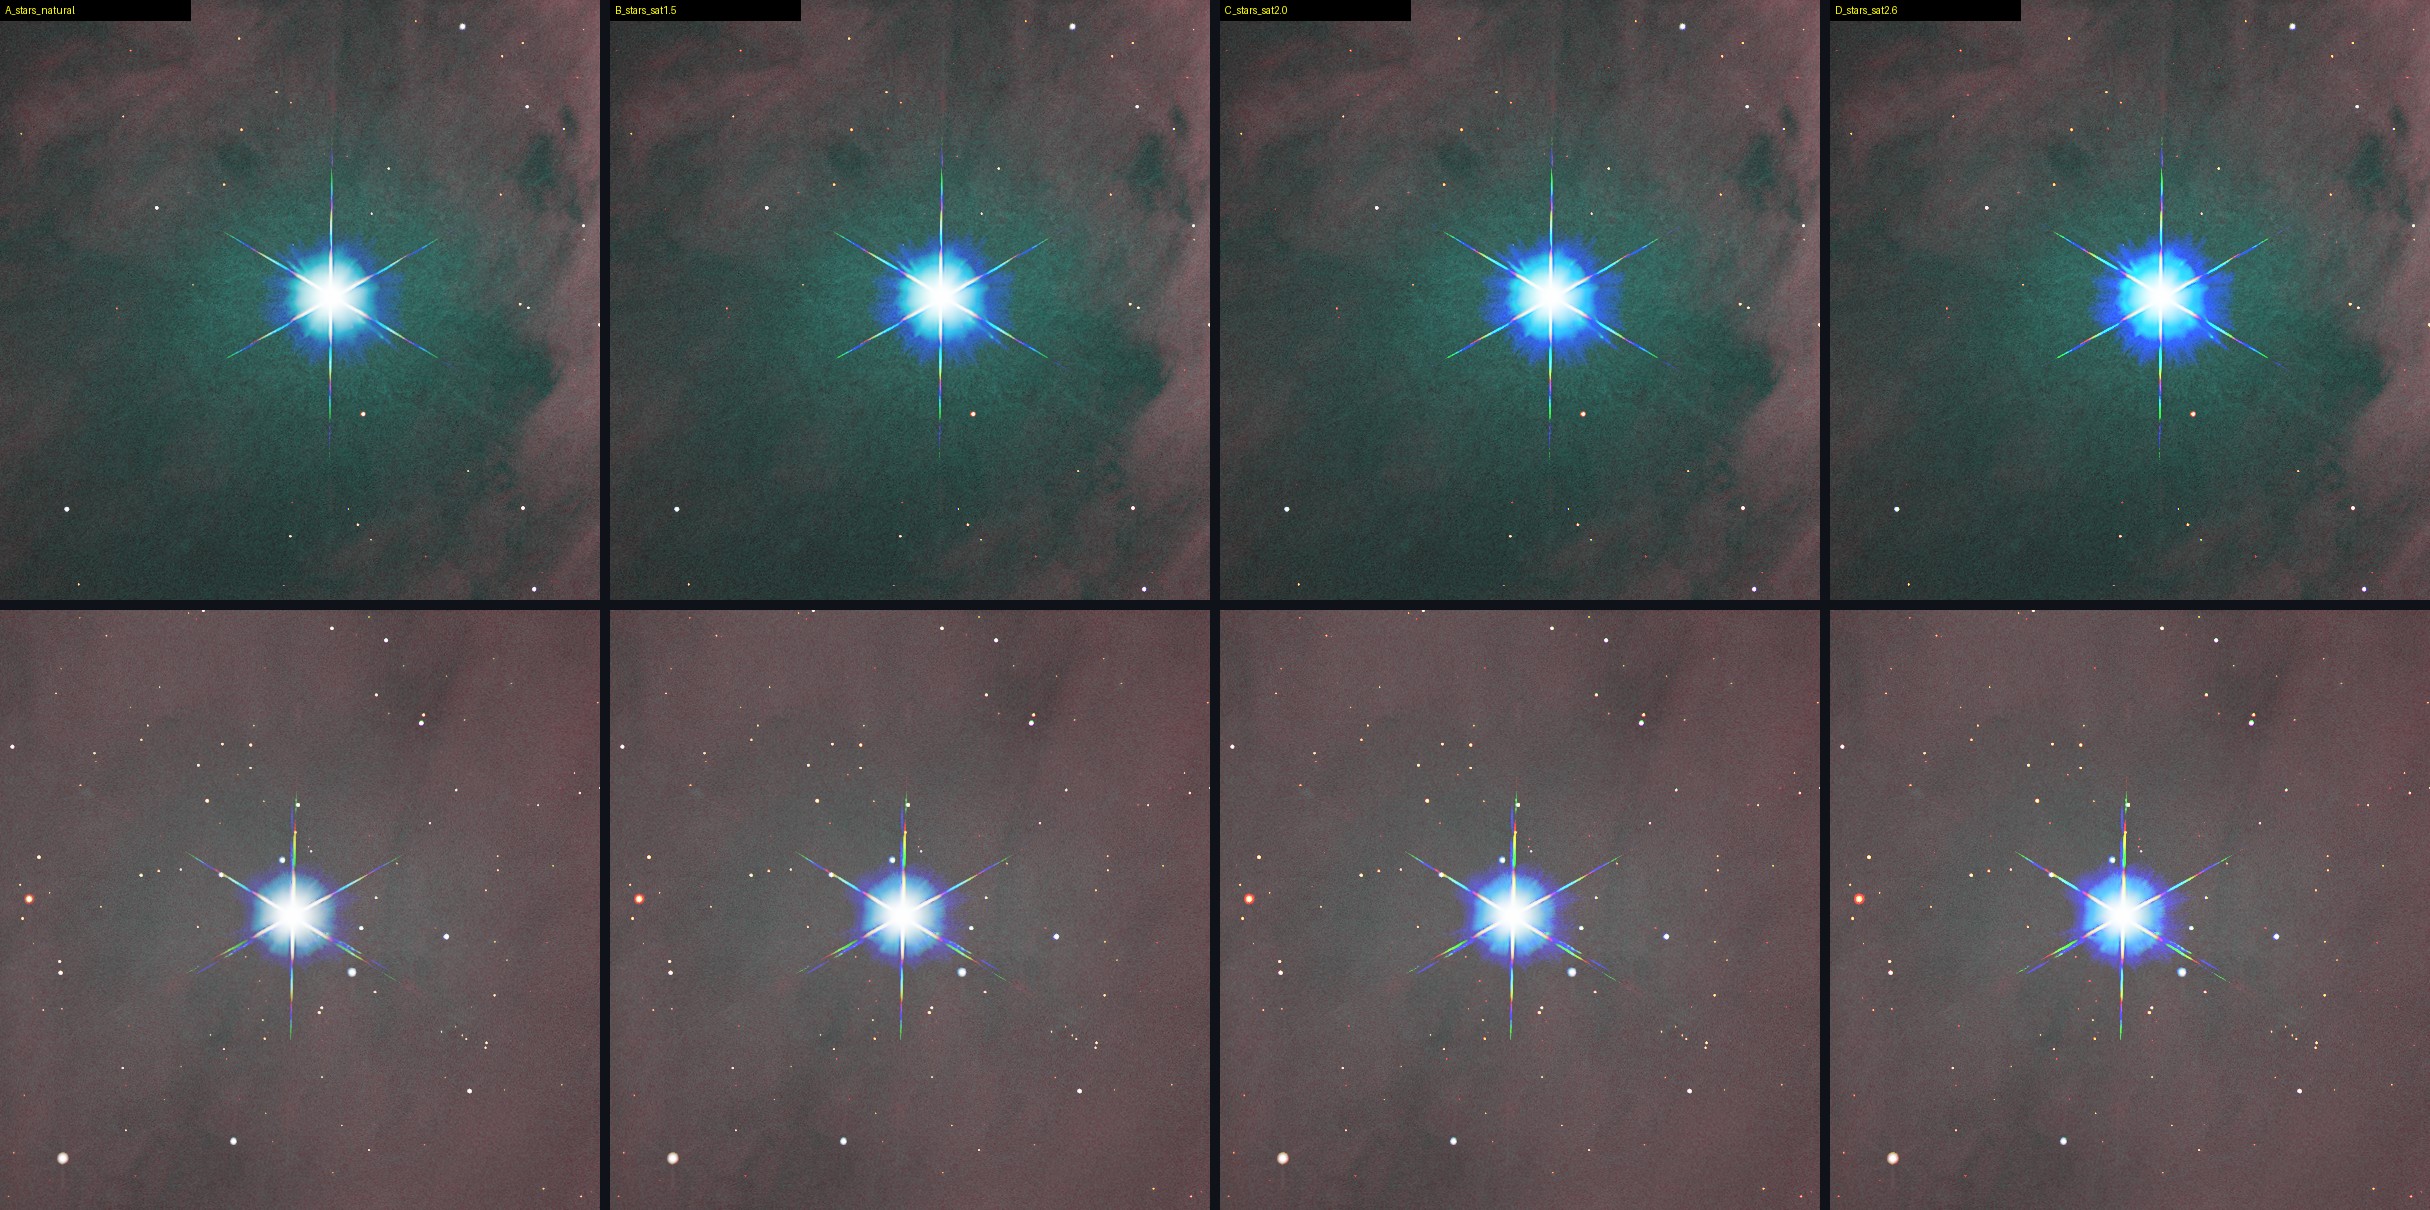
Hα goes to red, OIII to green and blue, as before, but the stretch is now a gentle midtones stretch on starless images that were first brought to a sky level of 0.15. The two narrowband channels share one curve, with OIII scaled up by 1.8 so the weak line shows. I also blend a little Hα into the blue channel (15 %, not too much), which warms the nebula slightly. Below are four versions that differ only in star colour: the stars image from the linear RGB, stretched by the STF amount, with its colour saturation raised in steps.
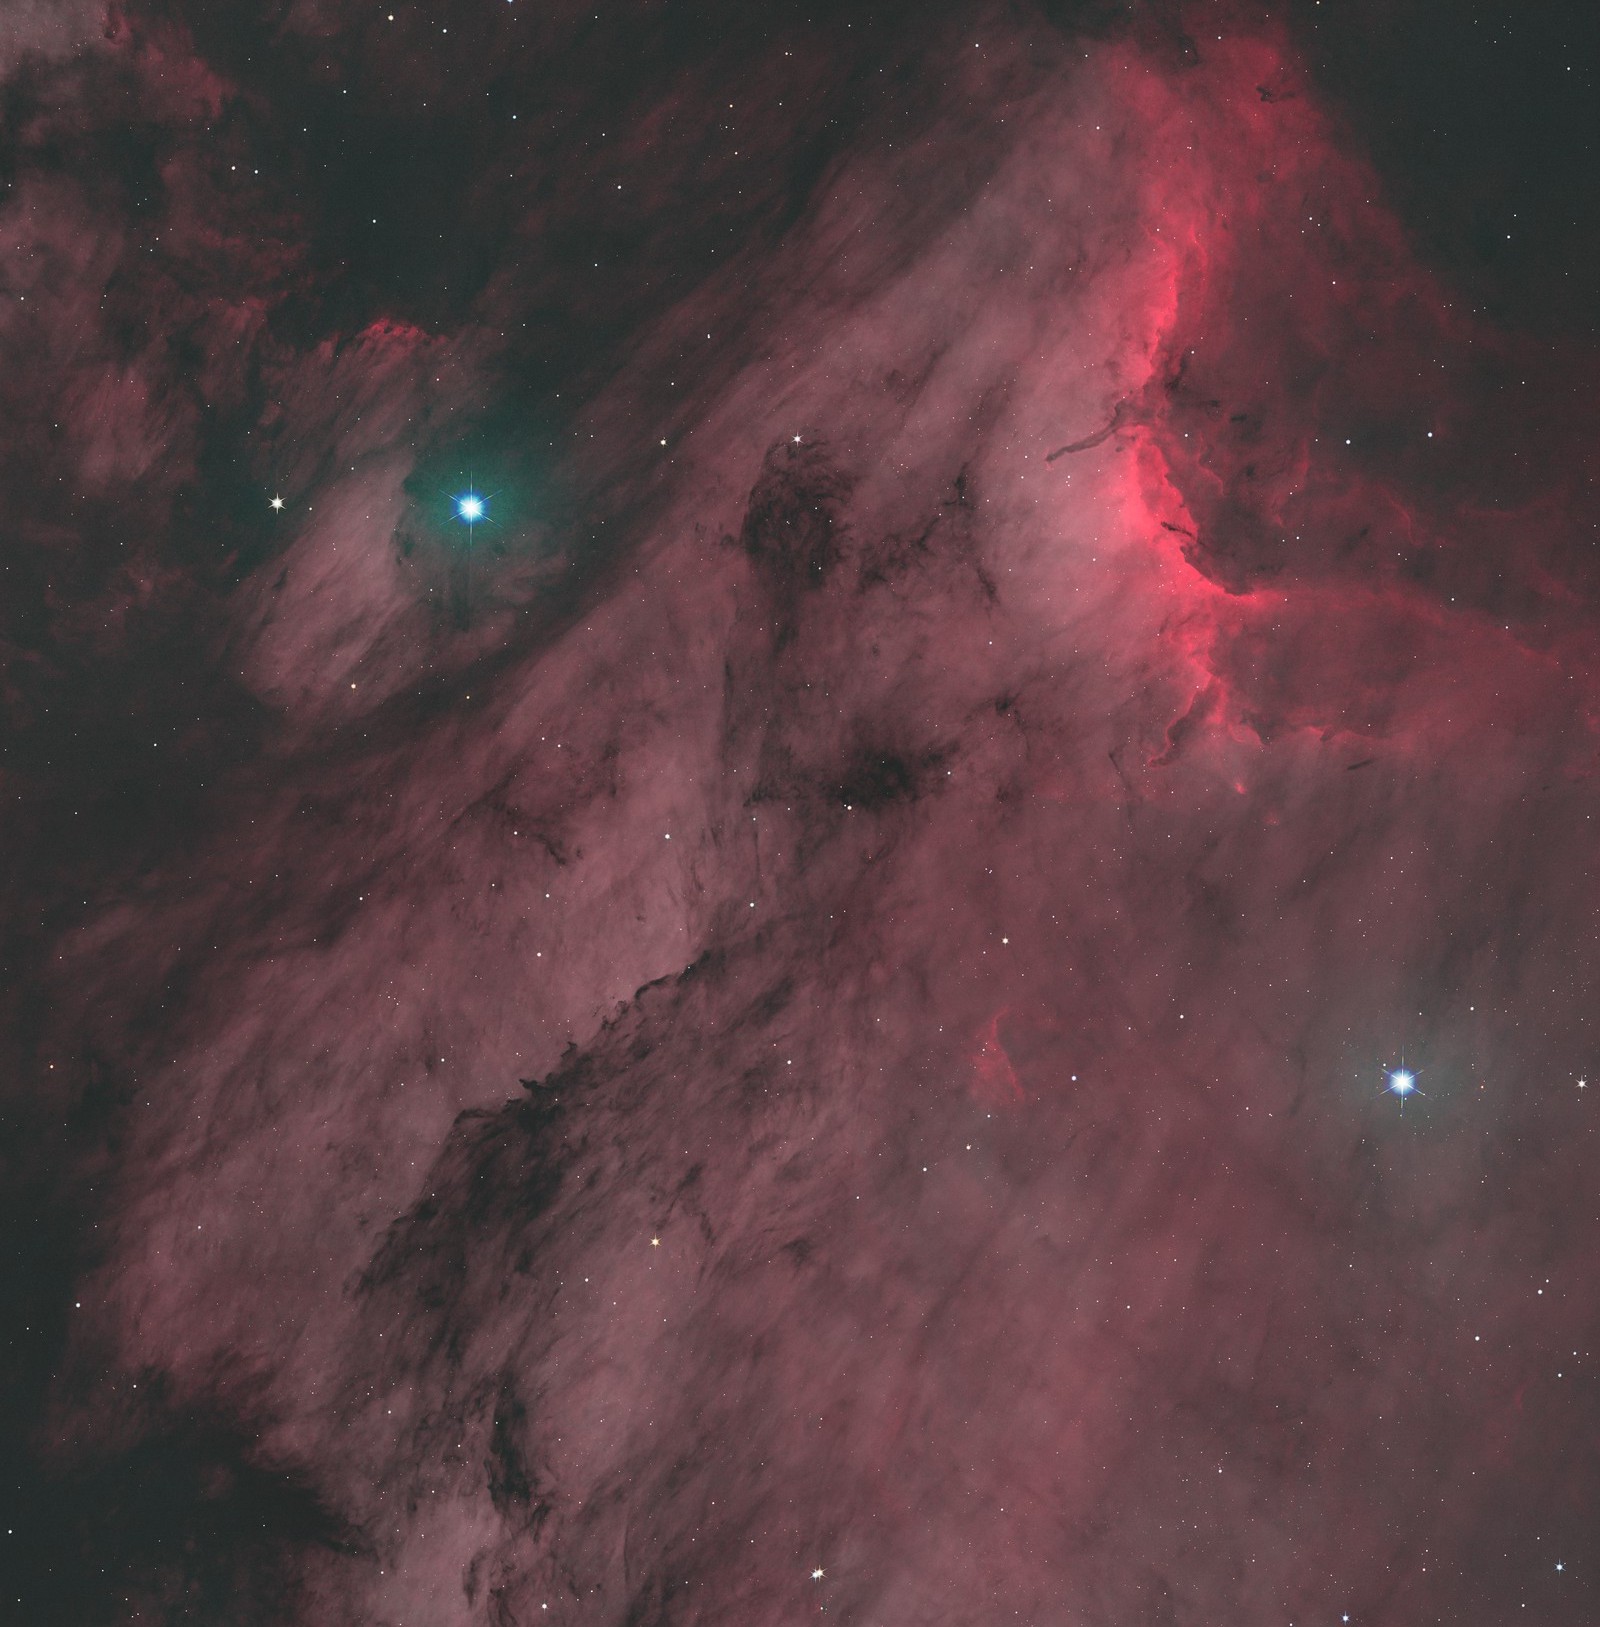
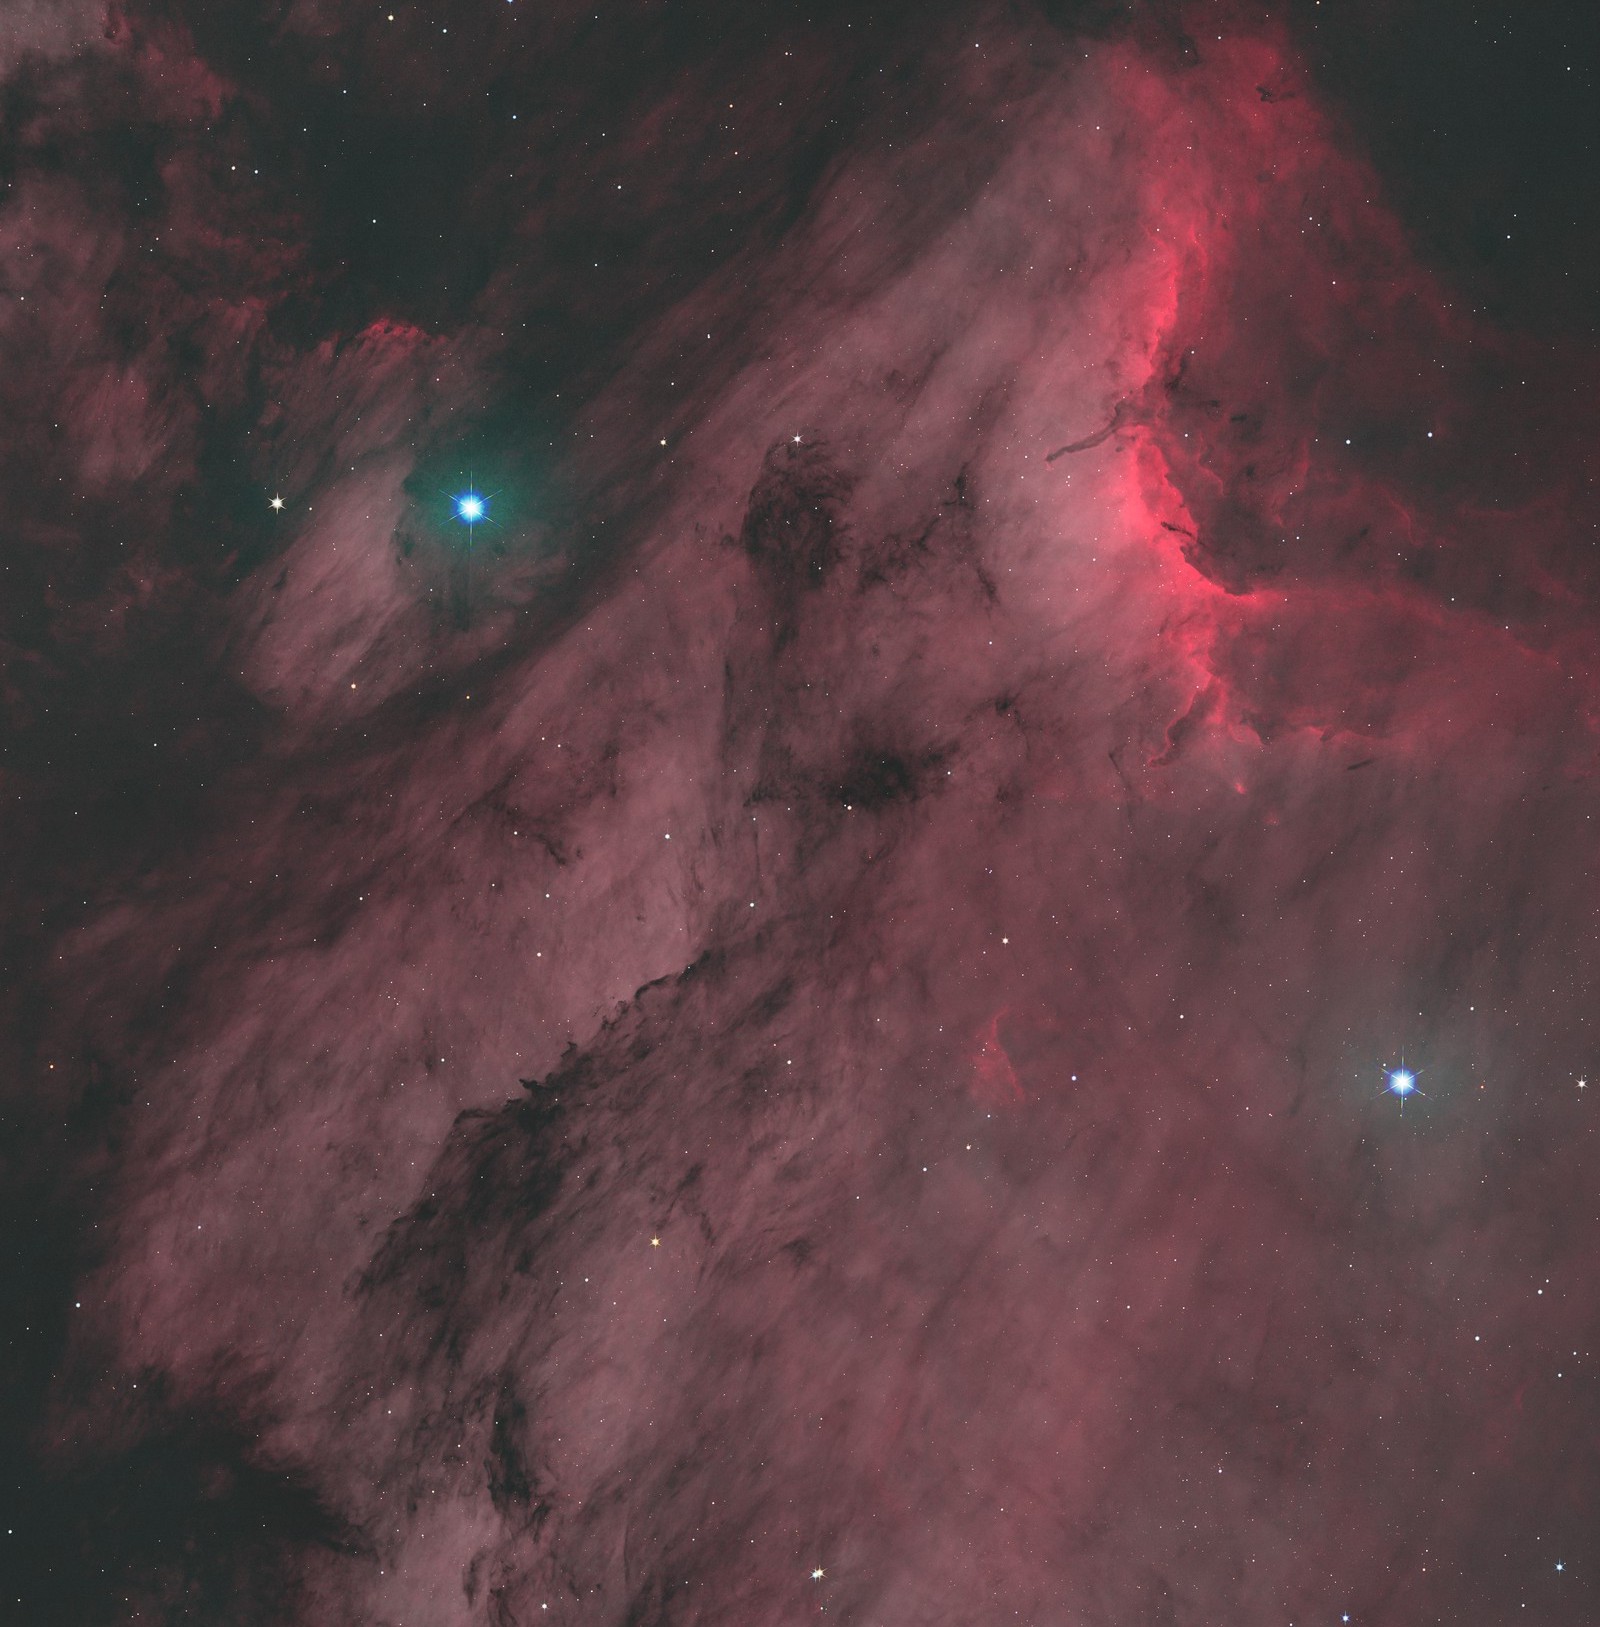
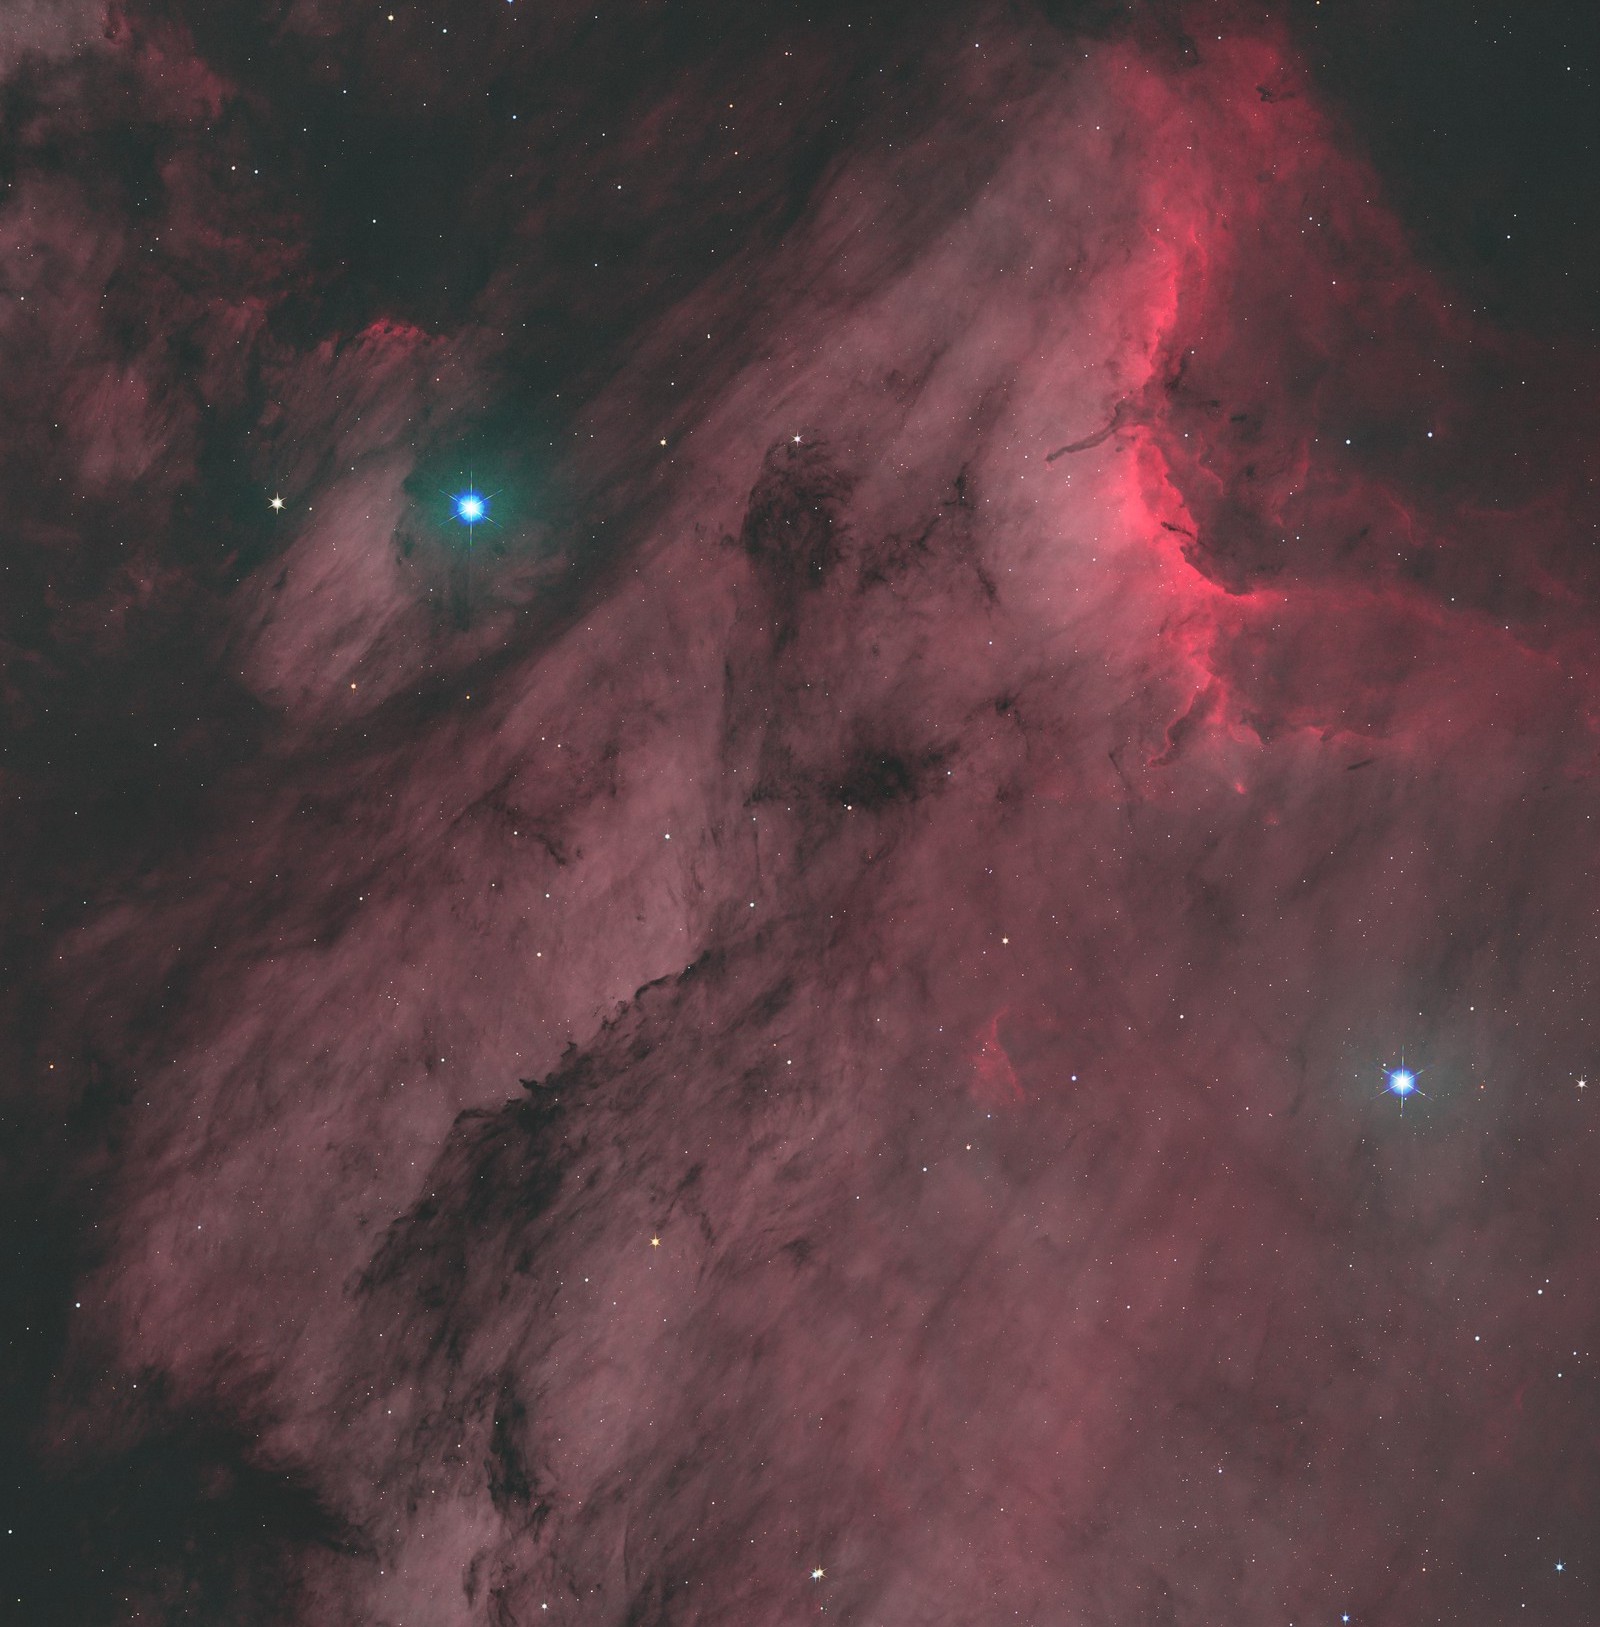
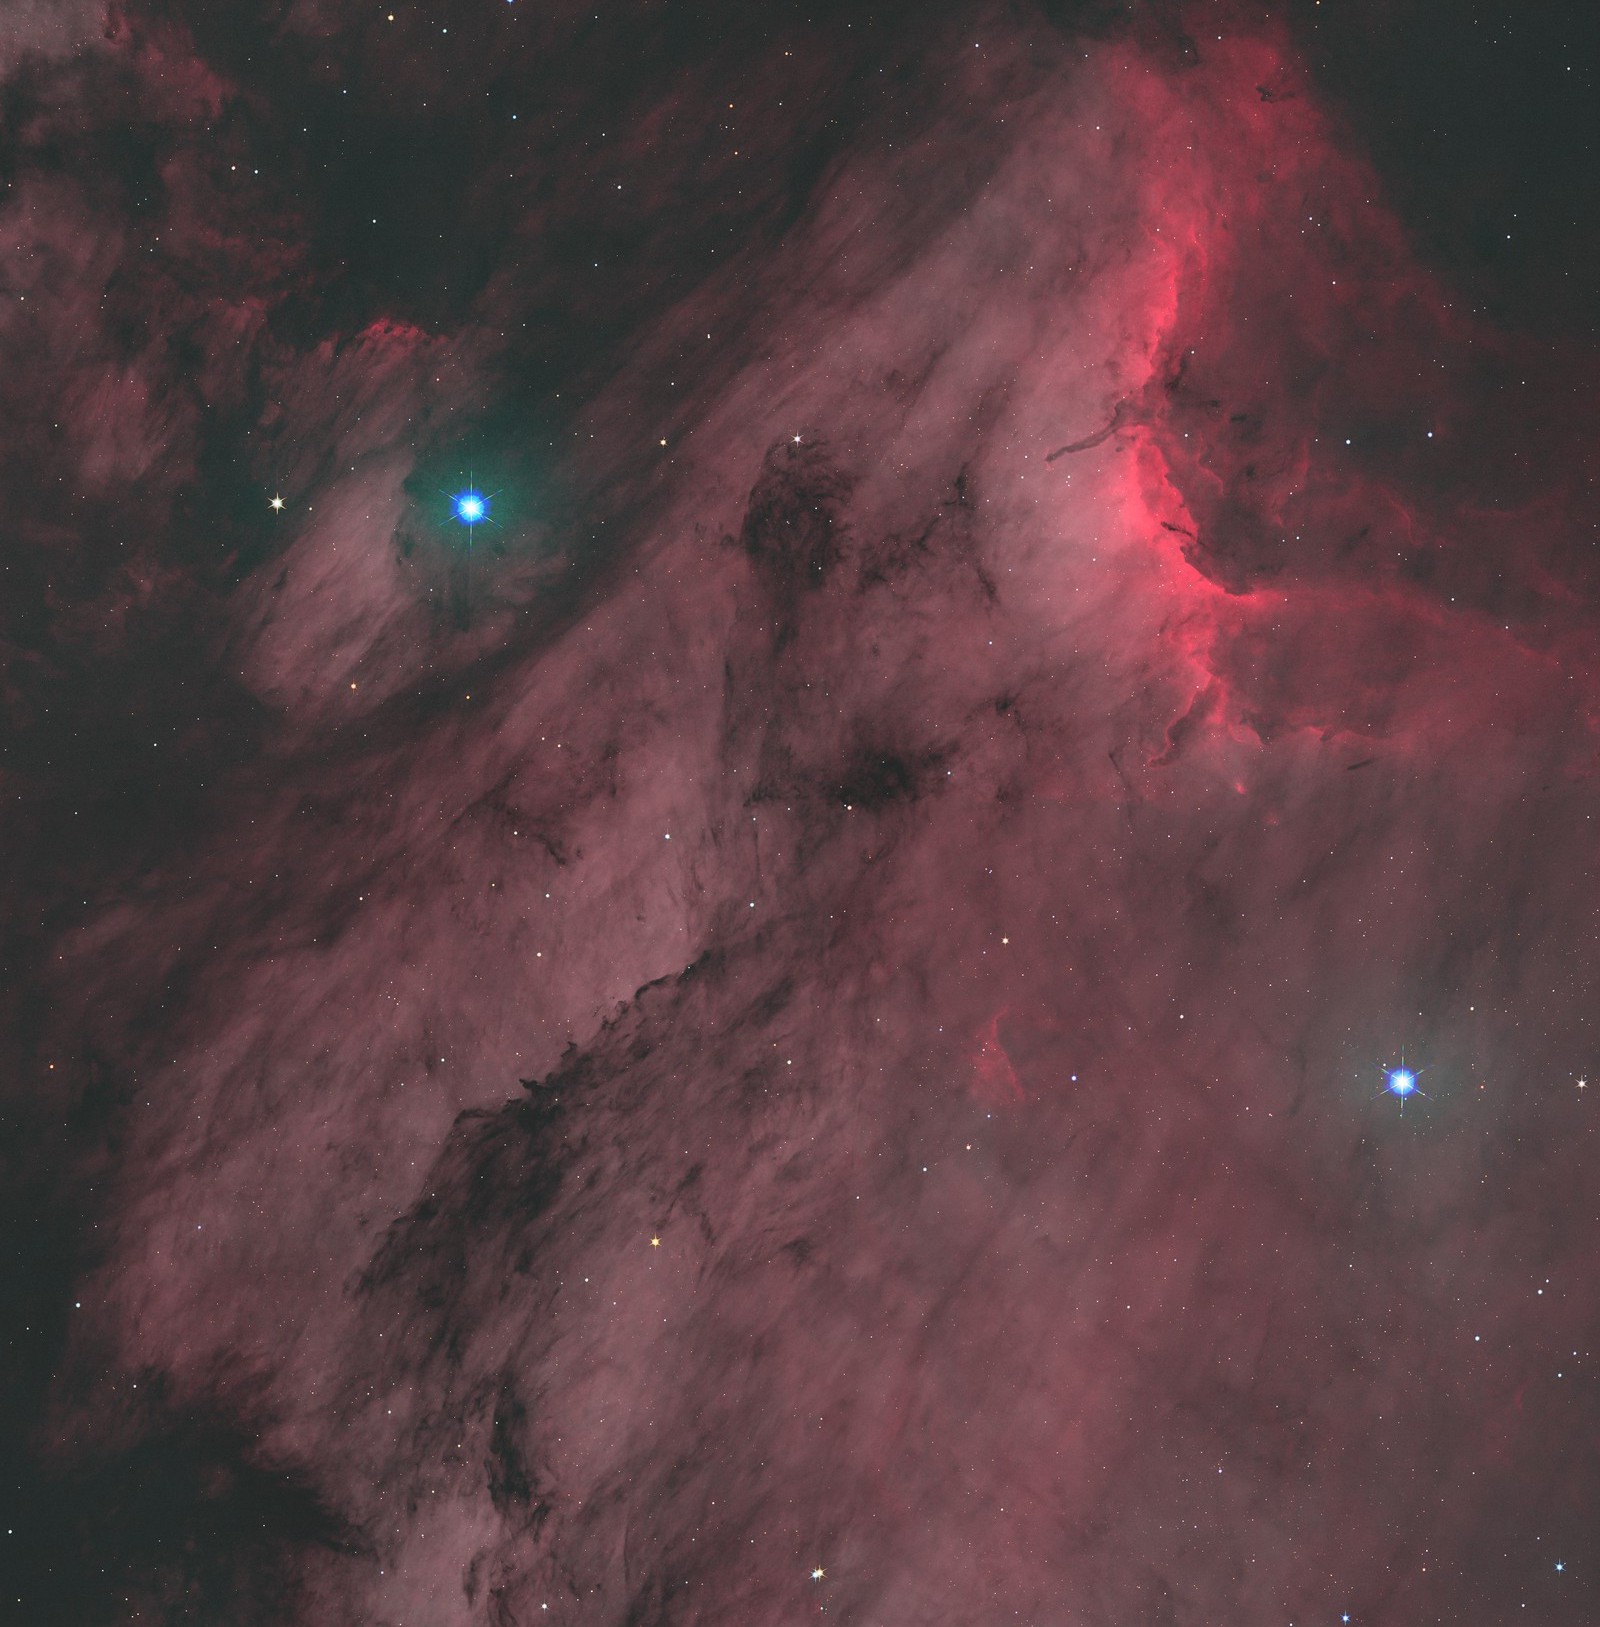
The star colours are all small differences at this scale, so here are two bright stars at 100 % for each version:
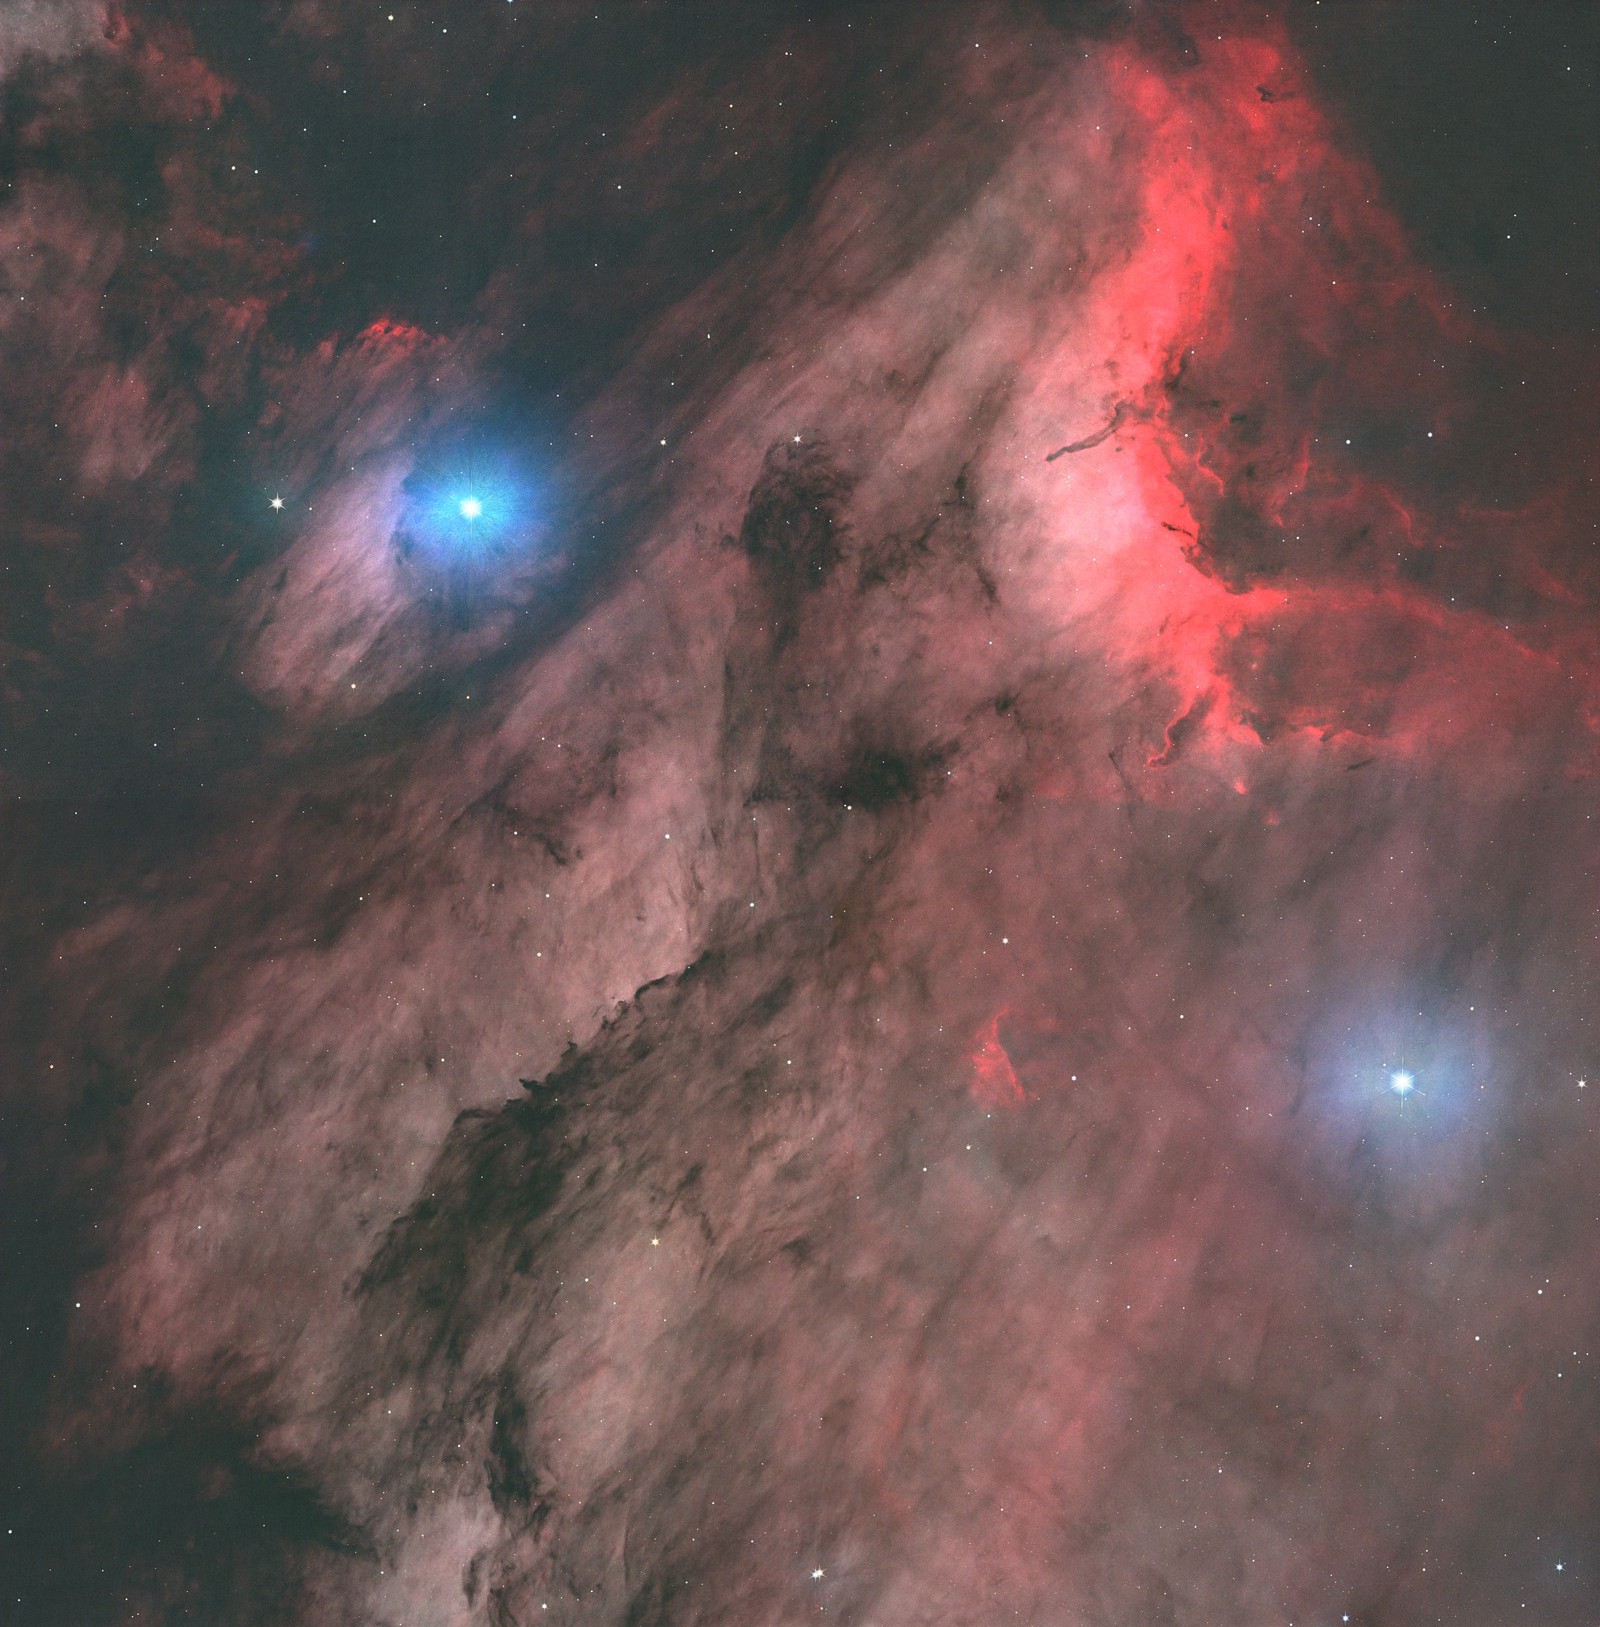
Option 1 again: RGB boosted, but gentle
| Setting | Value | What it does |
|---|---|---|
| Sky level | 0.15 | The 2nd-percentile level of each image is lifted to 0.15 after stretching (measured: 0.153 in HOO, 0.173 in the RGB boost) |
| Nebula median | about 0.27 (HOO), 0.34 (RGB boost) | Result of a gentle midtones stretch aimed at a pre-lift median of 0.235 |
| Hα into blue (HOO) | 15 % | Warms the nebula slightly |
| OIII scale (HOO) | ×1.8 | Brings up the weak OIII line relative to Hα |
| Star stretch | STF of the RGB, linked | Shadows 0.000387, midtones 0.00034 |
| Star saturation | ×1.0 to ×2.6 | Colour of the stars image scaled around its luminance |
Background level: 0.10, 0.125 or 0.15
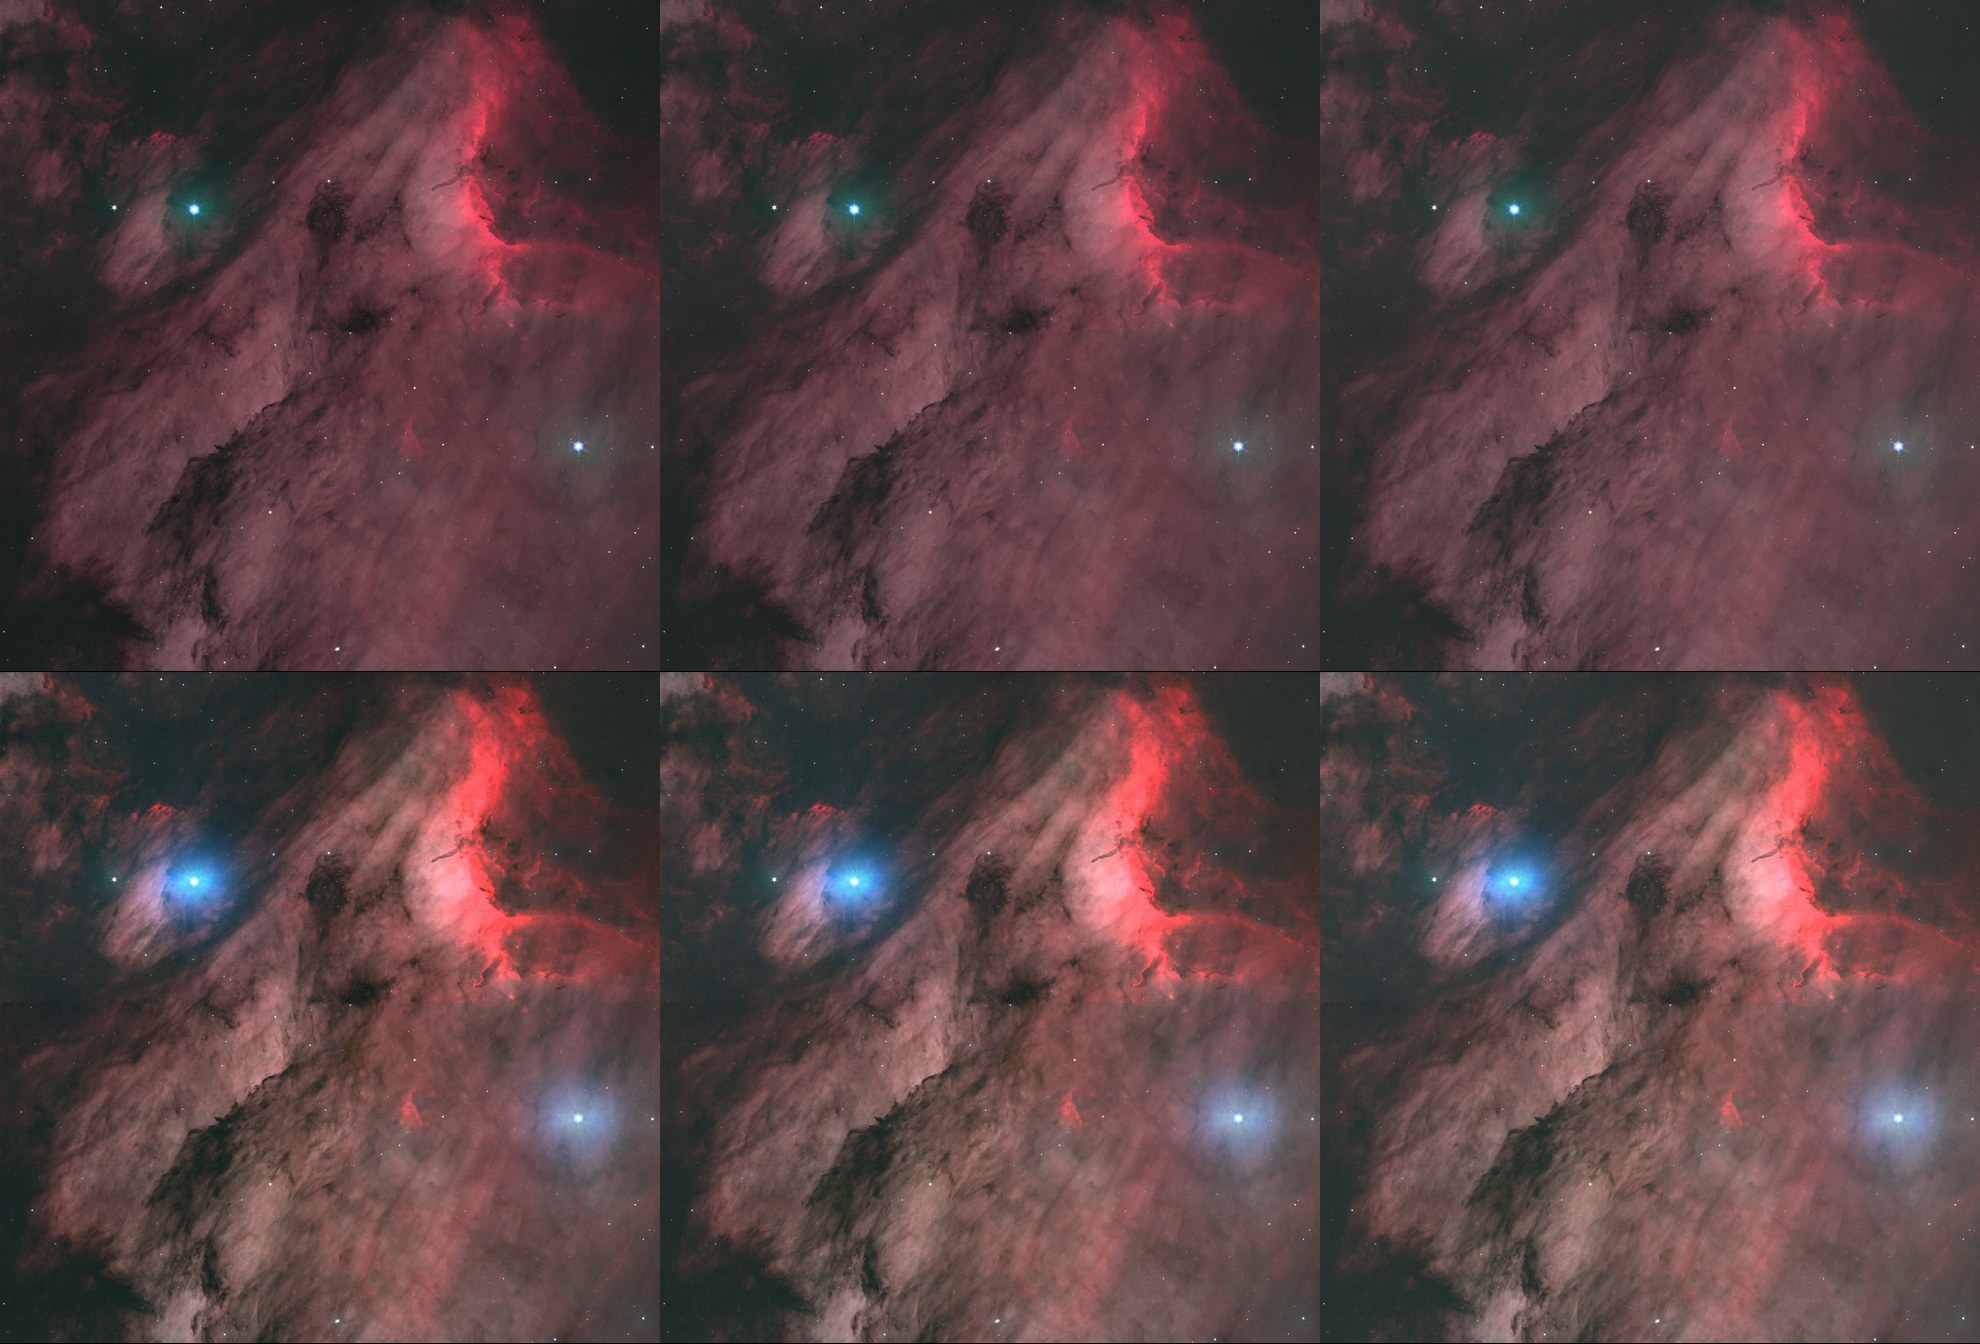
0.15 can be a little bright, so here are three background levels side by side. The top row is the HOO (option 2) and the bottom row the RGB boost (option 1), at 0.10, 0.125 and 0.15 from left to right. Everything else is identical, including the stars, which are stretched with the linked auto-stretch applied as a histogram transformation.
Checking the stars against the stretched RGB
For the stars I followed the usual routine exactly. The linear RGB gets an automatic, linked STF; PixInsight reports shadows 0.00038690 and midtones 0.00034430 (my own calculation gave the same numbers). StarXTerminator splits off the stars, and the same values are applied to the stars image as a histogram transformation. The halo-reduction option makes no difference to the stars image: both extractions came out identical.
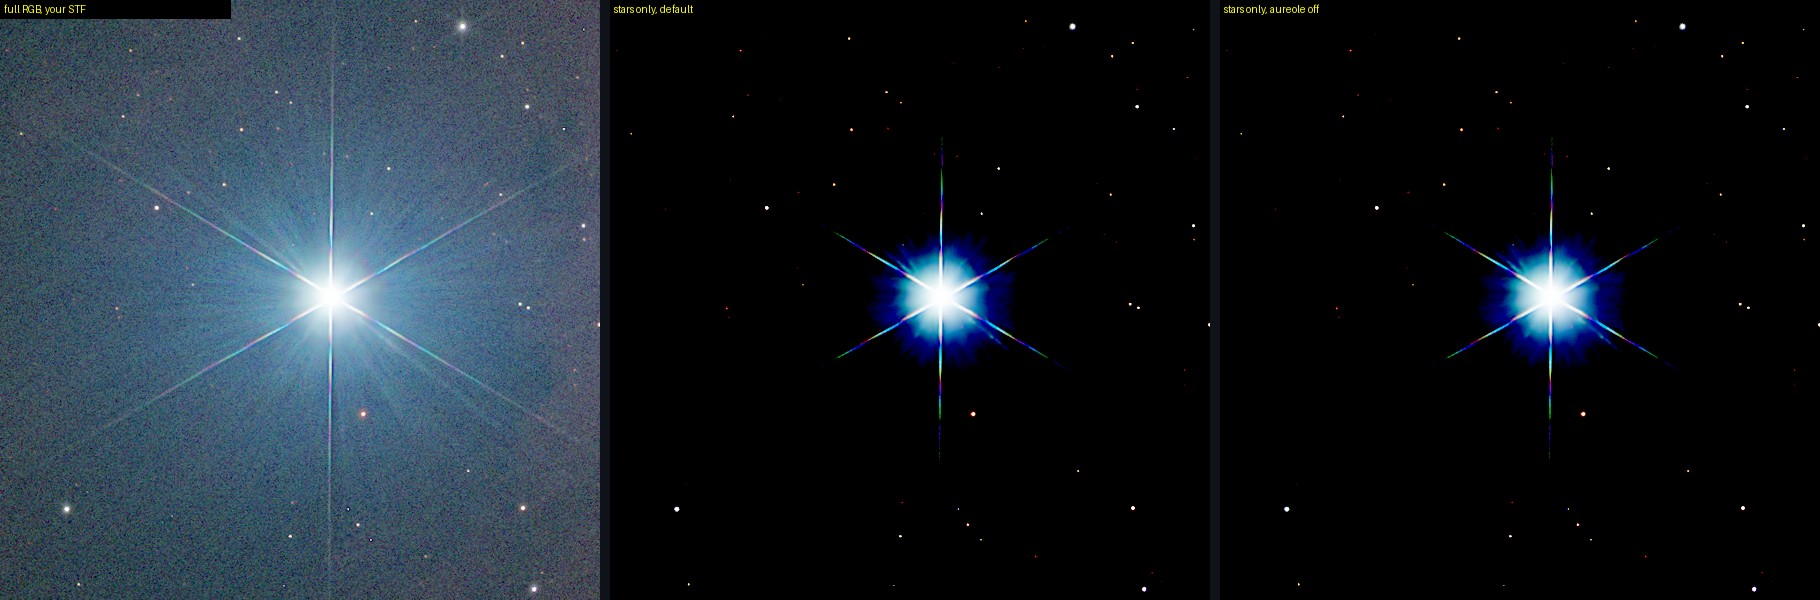
The stars-only version is not brighter than the star in the stretched RGB; its average value in rings around the core is lower (0.63 against 0.79 at the centre, 0.31 against 0.67 at 40 px). What is different is the colour: without the neutral sky behind it, the halo of the stars-only image is a saturated blue ring with a white core, and it ends sooner.
What I see
- The gentle versions look much more like real sky: the dust lanes are dark brown rather than black and the red Hα glow still stands out.
- The HOO has a noticeable teal glow around the bright star in the OIII region, which is real OIII emission near the star.
- The blue halo around the two brightest stars is still there in both options and gets stronger with more star saturation. In the RGB boost the brighter star still has a large blue blob.
- The brightness step along the left half of the top/bottom panel join (see the experiments above) is still in the data.
13. Third round: the same recipe, in the right order
The second round still had two weaknesses: the stars looked overexposed, and then, once that was fixed, there were far too few of them. The order that works is the one I normally use:
- Build the HOO in linear space. Hα goes to red, OIII to green and blue, and a little Hα (15 %) is mixed into the blue channel. The OIII is scaled up by 1.8, because the line is weak.
- Blend in some RGB, still linear. The starless RGB, scaled to the HOO level, is mixed in at 0 % or 30 %, which makes the colours more natural.
- Stretch that composite with one linked stretch, so it looks natural and the colours keep their relations. The dark areas are lifted to a background of 0.125.
- Prepare the stars. Stretch the stars image, then apply SCNR (green, average neutral, luminance preserved) to remove the green cast.
- Add the stars with a screen blend,
combine(starless, stars, op_screen()), as the last step.
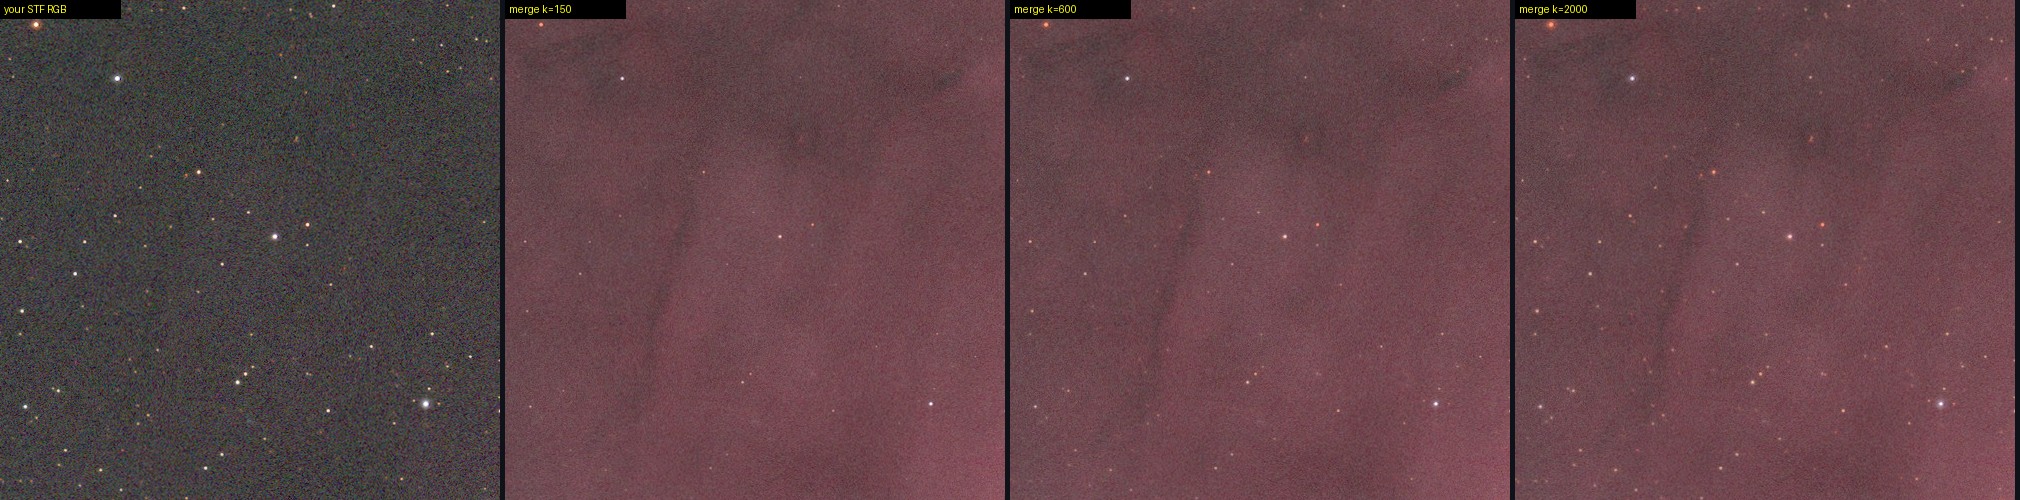
Why the stars looked overexposed
The auto-stretch (STF) is strong: with midtones of 0.00034, every star pixel above about 0.03 linear is mapped to nearly white. The brightest star only peaks at 0.08 linear, so it was not clipped in the data; the stretch clipped it, and about 3,800 pixels ended up pure white. That is acceptable next to an equally hard-stretched RGB, but once the nebula underneath is stretched more gently, every star becomes glaring. The stars need a stretch that keeps the highlights: a colour-preserving arcsinh with the white point at 0.2 linear leaves the bright stars with visible colour (about 410 pure-white pixels remain, which are stars that are genuinely saturated in the data).
Why there were too few stars
My stretched version showed about half the stars of the stretched RGB. The cause was a shadows clip. In the full RGB every star sits on a sky level of about 0.0005, so the STF shadows value of 0.000387 lies below the sky and clips nothing that matters. In the stars-only image the sky is zero, so the same clip removes every star whose own peak is fainter than 0.000387, which is most of the faint ones. The StarXTerminator stars image did contain them. With no shadows clip on the stars image and a strong arcsinh (k = 2000) the stars are back: 8,889 stars brighter than 0.30 in the stars image, against 10,638 for the full STF stretch.
Why a blue star turned green
The brightest star is blue in the stretched RGB, but in the pure HOO it sits in a teal-green glow. The H and OIII images were made starless before the merge (StarXTerminator, then NoiseXTerminator), and the star itself, its spikes and its core are gone. What remains is a smooth, round brightening of the OIII centred on the star, about 10 % above the sky and fading out by about 150 px. It is not in the Hα. StarXTerminator’s aureole removal made no difference at all (identical numbers), so it is not leftover halo that can be removed; it is in the data.
In the HOO the OIII feeds both green and blue, so that glow shows up as teal. Measured as hue around the star (120° is green, 180° teal, 210° blue): the stretched RGB is 196–207°, the pure HOO is 176–189°, and the HOO with 30 % RGB blended in is 195–203°. So the RGB blend brings the hue back, and letting the RGB take over more strongly around the brightest stars (a soft disc of about 90 px, 90 % RGB in the middle) gives 197–204°.
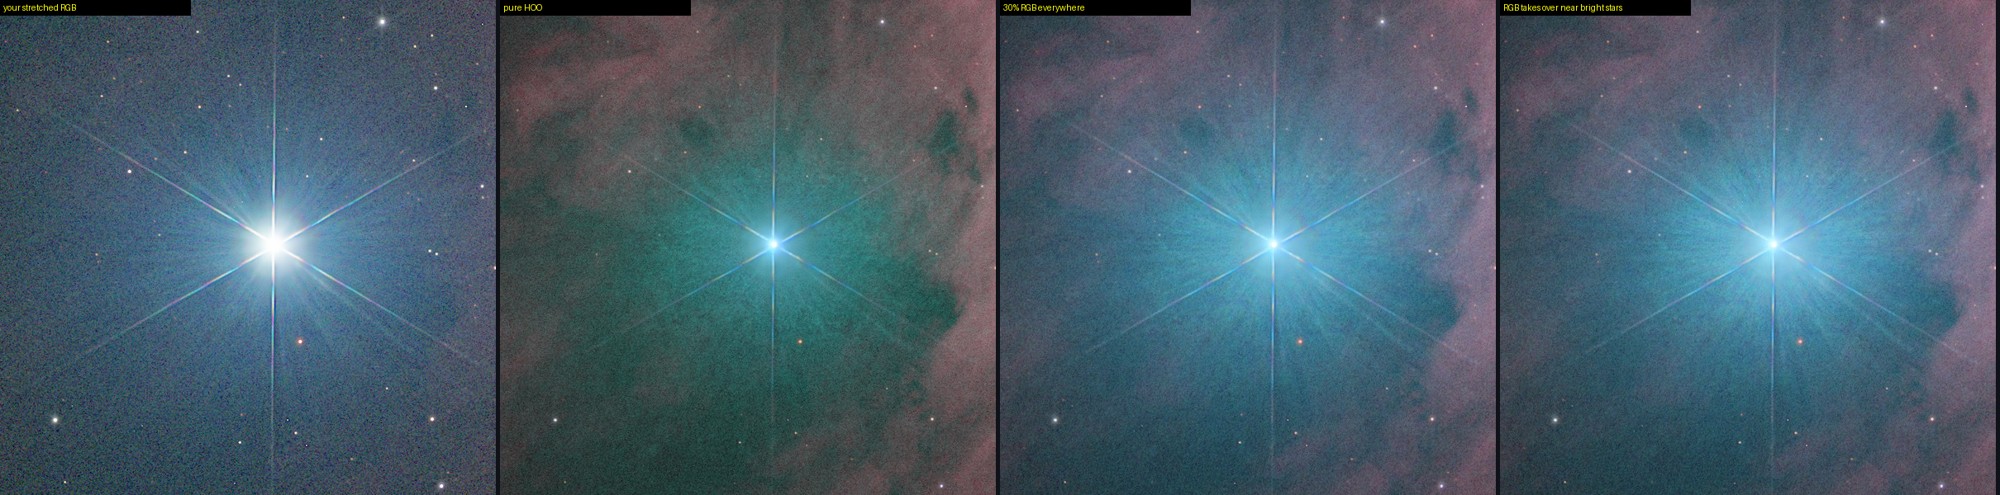
The saturation near the star is still higher than in the RGB (about 0.42 against 0.18–0.30), and the white core is smaller, because the stars are stretched with an arcsinh that protects the highlights rather than the STF.
14. Fourth round: a matrix to review
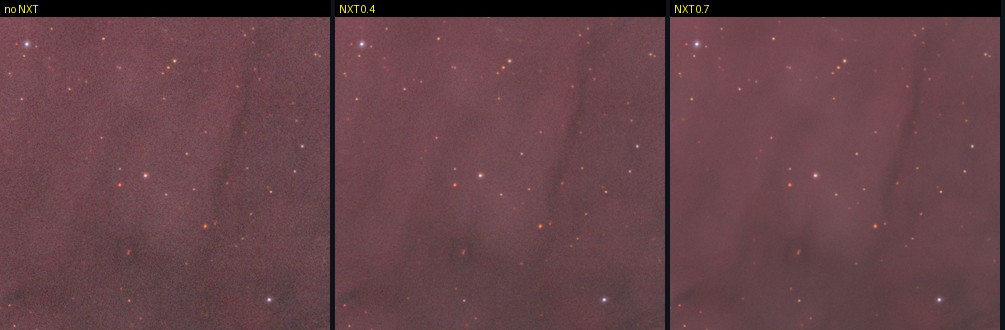
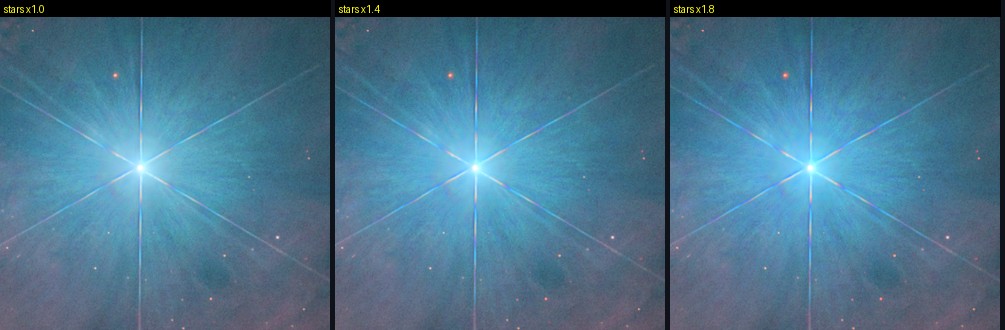
The merged image was good, but it was still missing the last finishing steps on the starless nebula. The order I use is: starless HOO (stretched) → NoiseXTerminator → a very gentle unsharp mask → and only then the slightly saturated stars on top. Instead of choosing the settings blind, I prepared a matrix of 27 full-frame images to review: three NXT strengths (none, 0.4, 0.7) × three unsharp-mask amounts (none, 0.10, 0.20) × three star saturations (×1.0, ×1.4, ×1.8). A review page with 100 % crops sits next to the images in output/matrix/.
Decision: no unsharp mask
I measured the noise in a dark patch of sky (the standard deviation of the image minus a slightly blurred copy) for the combinations that matter:
| Version | Fine noise | Mean sky level |
|---|---|---|
| no NXT, no USM | 0.0180 | 0.149 |
| NXT 0.4, no USM | 0.0105 | 0.149 |
| NXT 0.7, no USM | 0.0061 | 0.148 |
| NXT 0.4, USM 0.10 | 0.0404 | 0.184 |
| NXT 0.7, USM 0.20 | 0.0274 | 0.172 |

Even a very gentle unsharp mask turned the sky into salt-and-pepper speckle, made the noise about four times higher than with NXT alone, and also lifted the sky from 0.149 to 0.17–0.18, away from the 0.15 target. It was left out. (If sharpening is wanted later, it would have to be done through a luminance mask that protects the dark sky.)
NXT strength and star saturation
15. Fifth round: noise reduction once, and hot pixels
The order now is:
- Starless H and OIII from StarXTerminator, with no noise reduction.
- Starless RGB: NXT (denoise 0.90, detail 0.15, one iteration), then hot pixel detection and repair. This RGB is blended in at the bright stars, as before (RGB blend still in).
- Linear HOO (H→R, OIII→G+B, 15 % H into blue, OIII ×1.8) with the RGB blended in, one linked stretch, sky at 0.125.
- NXT on the stretched HOO (denoise 0.90, detail 0.15, one iteration), then hot pixel detection and repair.
- Stars-only image: arcsinh stretch (no shadows clip), SCNR, hot pixel detection, saturation.
- Screen the stars on top. No unsharp mask anywhere.
How the hot pixels are handled. A pixel counts as hot when it is brighter than its brightest neighbour by more than six times the local noise (and, for the stars-only image, also more than 2.5 times that neighbour and brighter than 0.03). Only those pixels are replaced, by the median of their eight neighbours; nothing else in the image is smoothed. The data turned out to be very clean:
| Image | Hot pixels fixed (R / G / B) |
|---|---|
| Starless RGB, after NXT (linear) | a few per channel (7 in B) |
| Stars-only image, stretched | 5 / 8 / 23 |
| HOO with 30 % RGB, after NXT | 5 / 4 / 8 |
| Pure HOO, after NXT | 5 / 18 / 22 |
Out of 28 million pixels per channel, that is a few dozen at most, so WBPP (with its darks and rejection) had already removed nearly all of them. The detector is conservative on purpose: lowering the threshold from six to three times the noise would flag 61 pixels, and to two times the noise 1,116, most of which are noise peaks rather than hot pixels.
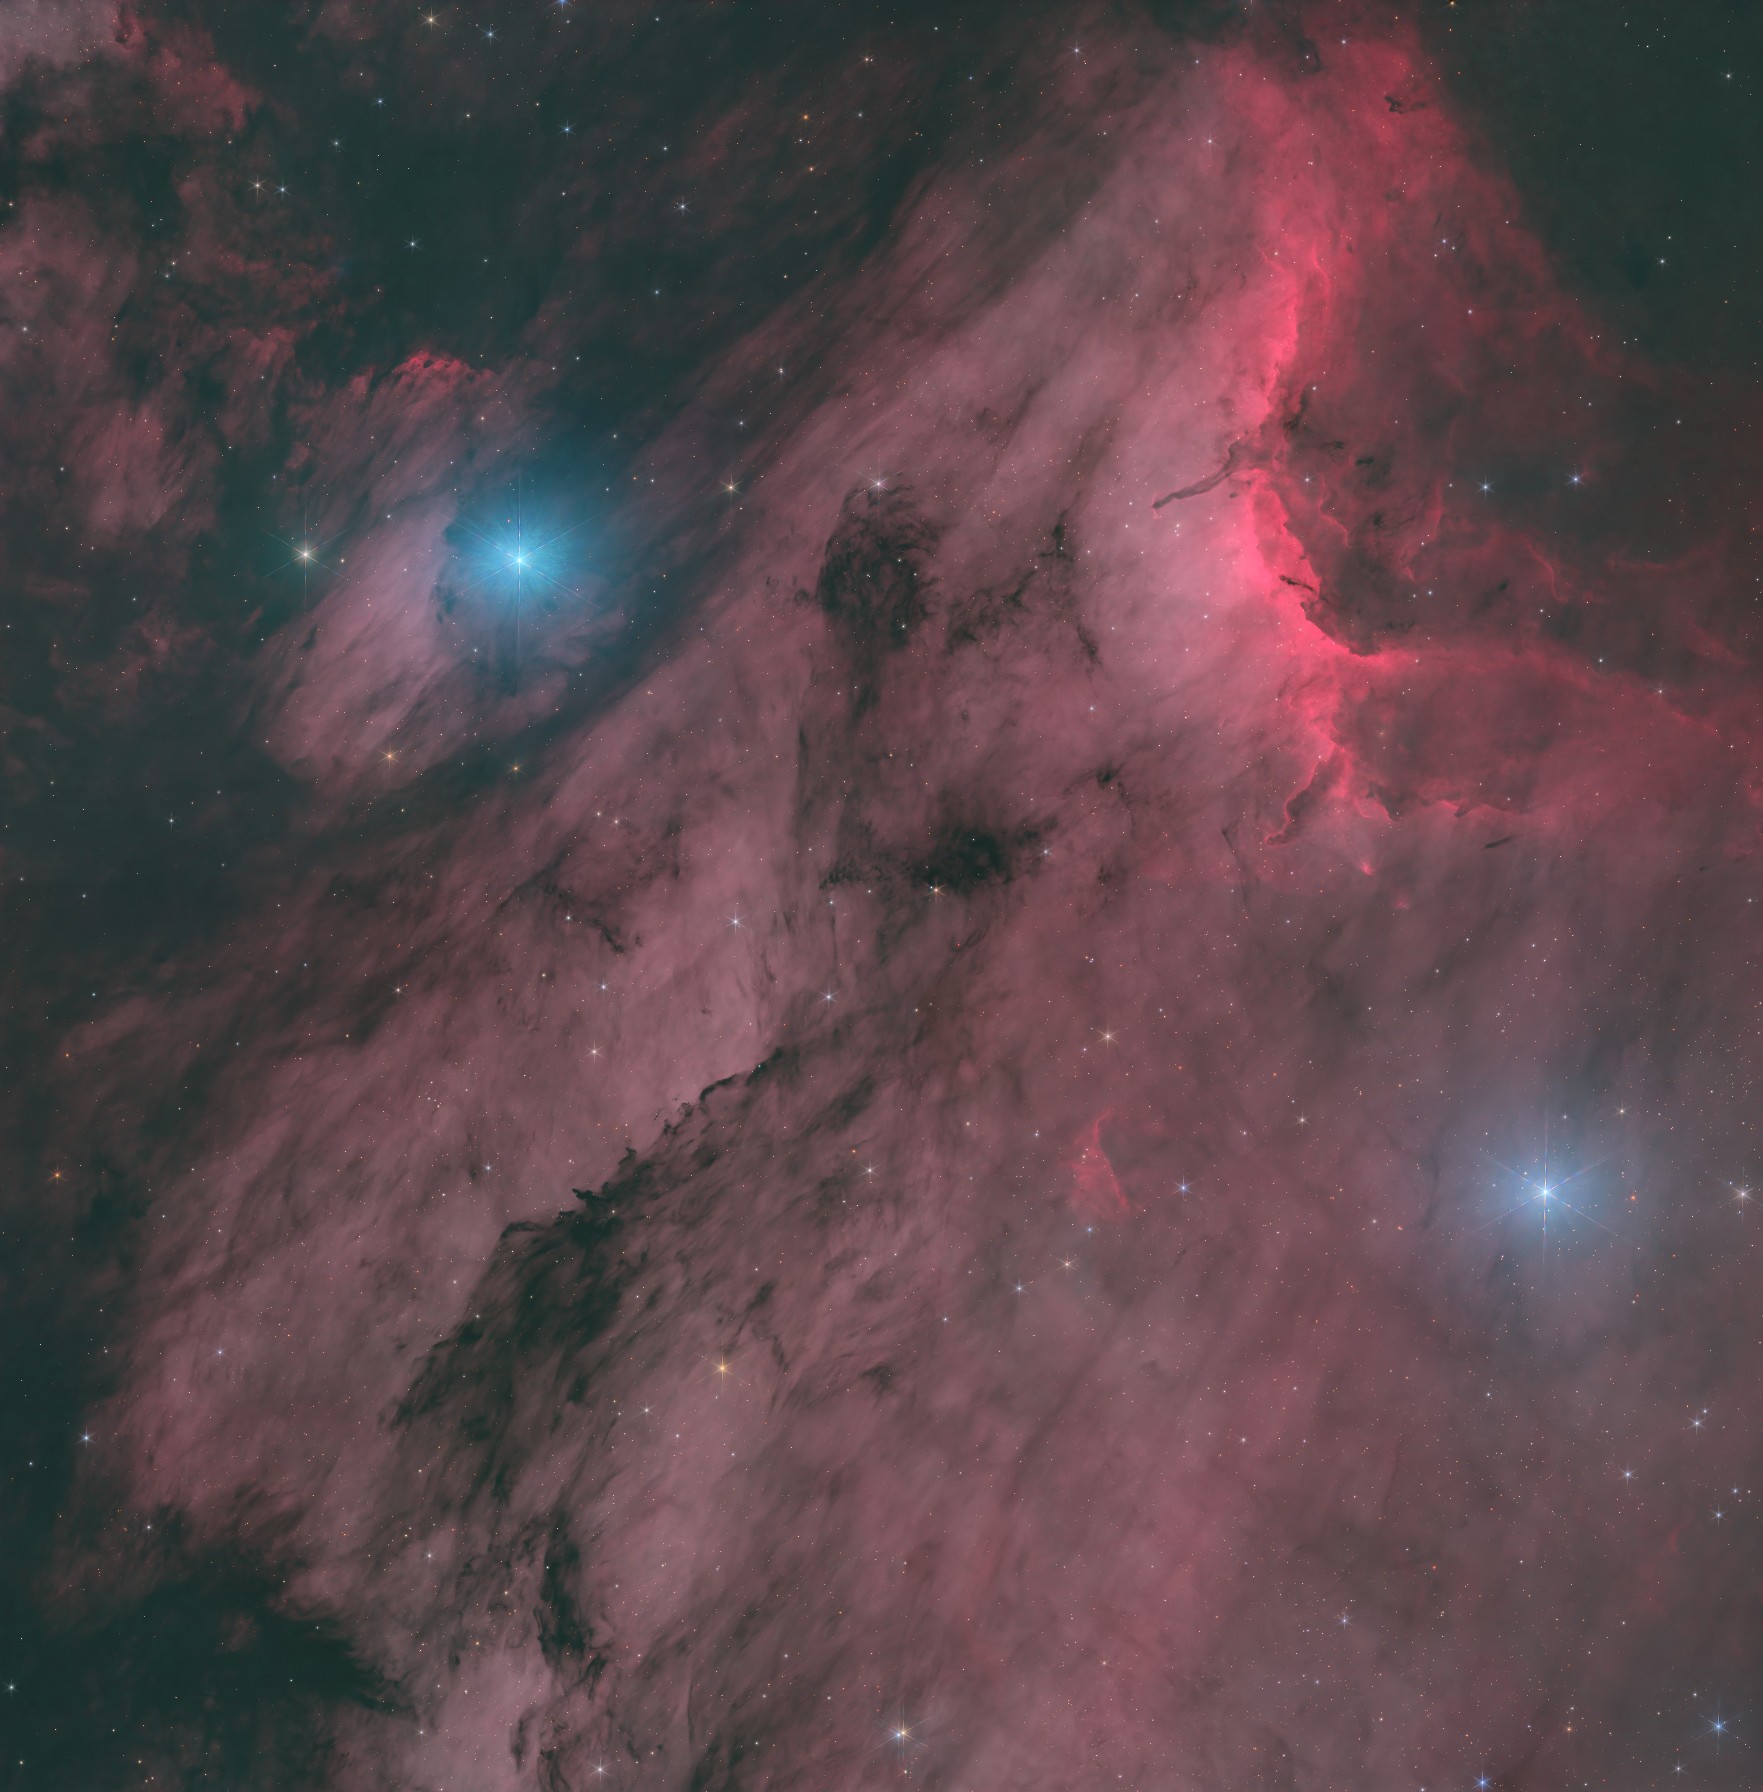
16. Sixth round: noise reduction before the merge
After looking at the comparison I settled on the HOO with the RGB blended in. One more change to the order: NoiseXTerminator goes on the HOO before it is merged with the RGB, and the RGB already has its own NXT. That also matches how NXT is meant to be used, on linear data. The final chain:
- Starless H and OIII (StarXTerminator, no noise reduction).
- Build the linear HOO (H→R, OIII→G+B, 15 % H into blue, OIII ×1.8) and run NXT on it (denoise 0.90, detail 0.15, one iteration).
- Starless RGB: NXT with the same settings, then hot pixel repair.
- Merge: the RGB is blended into the denoised HOO (30 %, up to 90 % around the brightest stars), then one linked stretch to a sky level of 0.125.
- Hot pixel detection on the stretched result.
- Stars-only image: arcsinh stretch, SCNR, hot pixel detection, saturation ×1.4.
- Screen the stars on top. No unsharp mask, and no second NXT pass.
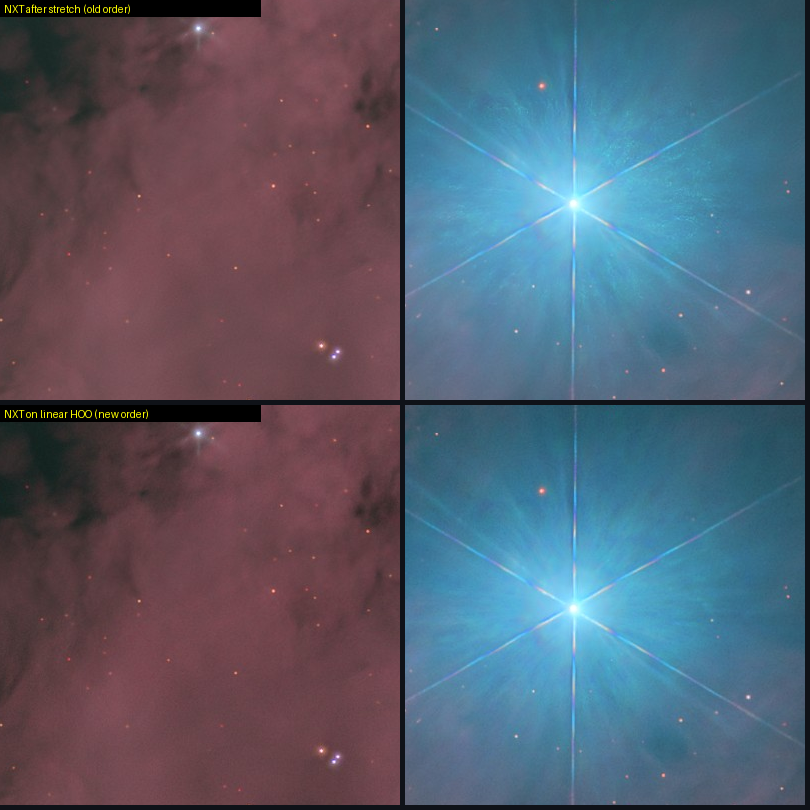
Measured on the same dark patch of sky (fine-scale noise, as before), the two orders come out about equal: 0.0049 for NXT after the stretch and 0.0055 for NXT before the merge. So the order is not a big difference in noise. In 100 % crops the nebula looks equally smooth in both; the one visible difference is the OIII glow around the brightest star, which has a fine speckled texture in the old order and is smoother in the new one. I kept it because the denoising now happens on linear data, as intended, and because it is the order I normally work in.
Hot pixels: 5 / 8 / 23 on the stars (R / G / B) and 7 / 0 / 1 on the stretched merge, so the merge needed very little repair.
17. Seventh round: separating star luminance and colour
An idea to improve the star colour: treat the luminance and the colour of the stars separately, the way an LRGB image is built.
- Make a luminance version of the stars (kept sharp, never blurred).
- Make a colour version (the colour ratios R/Y, G/Y, B/Y).
- Blur the colour slightly with a Gaussian (sigma 1.5 px; flux-weighted, so the faint halo of a star does not bleed its colour outwards).
- Raise the saturation a tiny bit (×1.25 around grey).
- Reduce greens and purples: SCNR on green (average neutral, amount 0.8) and a purple/magenta reduction that lifts green towards the lower of red and blue (amount 0.6); the colour is renormalised so it carries no brightness.
- Recombine the colour with the original sharp luminance.
- Screen the result onto the HOO/RGB image as before.
The idea is sound, and it is standard practice. Two remarks: the blur must only touch the colour, never the luminance, or the stars soften; and the reduction of purple needs its own step, because SCNR on green does nothing about magenta fringes. The hue of the star pixels that carry colour shows what changed:
| Stars | Green | Purple / magenta | Blue | Orange / red |
|---|---|---|---|---|
| Previous stars (SCNR + saturation ×1.4) | 0.0 % | 3.4 % | 44.4 % | 51.9 % |
| Luminance/colour recipe | 0.0 % | 1.3 % | 45.9 % | 52.7 % |
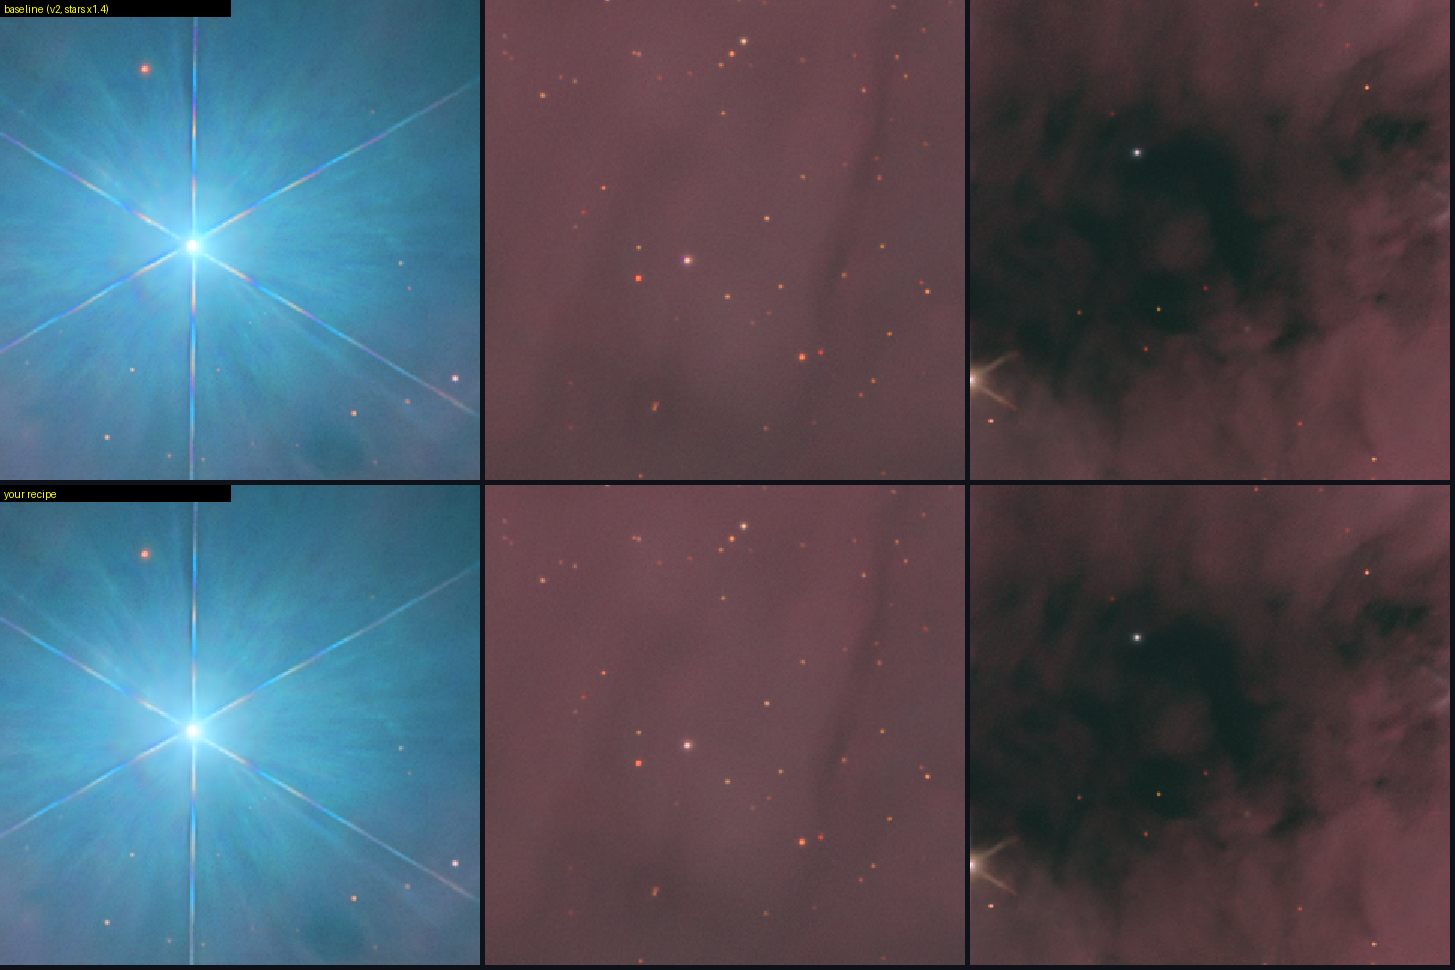
What changes: the purple tinge on the diffraction spikes largely disappears, and the spikes become cleaner blue and orange. The purple share of the star pixels with colour drops from 3.4 to 1.3 %. The greens were already gone after SCNR. The stars stay as sharp as before, since the luminance is unchanged. The differences are subtle in the star field and at this scale; the diffraction spikes of the brightest star are where it shows. Not yet decided: whether to adopt it, and the exact values (blur sigma, saturation, purple amount).
18. Eighth round: adjustments by hand on the starless image
Before the stars go back on, the starless HOO+RGB image (output/adjust/HOORGB_starless_stretched.xisf, stretched, NXT on the linear data, hot pixels repaired) was adjusted by hand in PixInsight. This is the one stage that is not scripted. The order was: curves, then histogram, then unsharp mask.

HOORGB_starless_stretched.| Step | Settings | Effect |
|---|---|---|
| 1. CurvesTransformation, RGB/K (all channels together) | A curve with 7 points, gently S-shaped. Read from the screenshot, approximately (input → output): 0 → 0, 0.12 → 0.10, 0.30 → 0.31, 0.42 → 0.455, 0.63 → 0.66, 0.75 → 0.73, 1 → 1 | Slightly darker lows, brighter mid-tones (about +0.03 around 0.4–0.6), and the top end held back so the bright red arc does not clip |
| 2. HistogramTransformation, RGB/K | Shadows 0.02531646 (56,124 pixels = 0.197 % clipped), highlights 0.97215190 (28,836 pixels = 0.101 % clipped), midtones 0.48930481 | Moves the black point up and the white point down a little for more contrast, and a very slight mid-tone lift |
| 3. UnsharpMask | StdDev 1.30, amount 0.76, target Lightness (CIE L*), deringing off, dynamic range extension off | Sharpens the lightness only, so colours are not touched |
The curve points are read off a screenshot, so they are approximate; the histogram and unsharp-mask values are exact. The saved result of these three steps is what the stars will be screened onto.
The stars added, and what the adjustment did to the noise
The adjusted starless image was saved over the original file; a backup copy is output/adjust/HOORGB_starless_adjusted_BACKUP.xisf. The stars were then screened on with combine(starless, stars, op_screen()), in four versions: the previous stars at saturation ×1.0, ×1.4 and ×1.8, and the luminance/colour version. The results are in output/adjust/final/ (32-bit XISF, original orientation, plus rotated JPEGs and a crop comparison).
Measured against the version before the hand adjustments:
| Before | After | |
|---|---|---|
| Sky level (2nd percentile of lightness) | 0.143 | 0.104 |
| Fine-scale noise, dark sky patch | 0.0036 | 0.0141 |
| Fine-scale noise, glow around the brightest star | 0.0044 | 0.0140 |
| Pixels at the white limit | 0.051 % | 0.051 % |
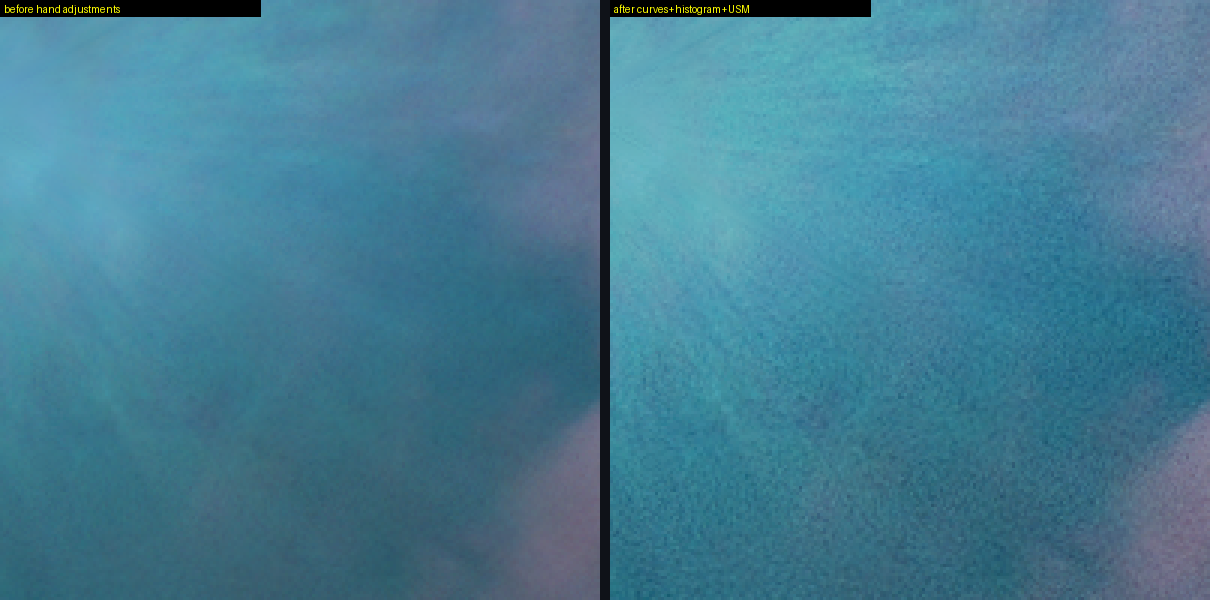
So the unsharp mask (amount 0.76, sigma 1.3) brings out structure and also amplifies the noise by about a factor of three to four; it is no posterisation, since the file has hundreds of thousands of distinct levels. The sky level also moved from about 0.14 to 0.10. Possible ways to keep the sharpness and lose some of the grain: a lower amount (for example 0.3–0.4), a larger sigma, or a lightness mask so that the smooth sky and glow are protected. The versions without any unsharp mask are still available.
Two things to watch (before the result was checked): the histogram step clips 0.2 % of the pixels in the shadows and 0.1 % in the highlights, and the sky level drops from the 0.125 it was built at. And the unsharp mask here is much stronger (amount 0.76, sigma 1.3) than the 0.10–0.20 tried earlier on the whole frame, which already put speckle into the dark sky. This time it is applied to the lightness of an image that already has NXT and a contrast curve, and the speckle may behave differently, so the dark sky is worth checking at 100 % before the stars are added.
19. Decision log
Astrophotography is a matter of experimenting, so here is every decision taken since WBPP, with the reason.
| Decision | Why |
|---|---|
| Check every panel edge for bright stars, mask the clipped copy, merge with edge shrink 0 | Truncated stars and a thin overlap produced dark holes and a wedge at the panel joins |
| Crop all five mosaics to one rectangle 160 px inside the data | Stars on the outer border cannot be masked; a common crop keeps the filters aligned |
| Process RGB, H and OIII separately, merge late | RGB carries colour and stars; narrowband carries detail and is much deeper |
| Option 2 (HOO with RGB stars) as the main route, option 1 as a variation | Best nebula contrast; the natural-colour boost is kept as a comparison |
| Build the HOO in linear space (H→R, OIII→G+B, 15 % H into B, OIII ×1.8), blend in 30 % RGB, then one linked stretch | Keeps colour relations; separate stretches had made the OIII dominate |
| Sky background at about 0.125 (0.10–0.15 compared) | No real sky is pure black; 0.15 was slightly bright |
| Stars from the linear RGB with StarXTerminator, stretched on their own with an arcsinh, no shadows clip, SCNR applied | The STF stretch clipped bright stars; its shadows clip deleted the faint ones from a stars-only image; SCNR removes the green cast |
| RGB takes over locally around the brightest stars | The OIII glow around the star made a blue star look green |
| Stars added last with a screen blend | Matches the usual workflow and keeps the stars independent of the nebula stretch |
| NoiseXTerminator on the linear HOO and on the starless RGB, each before they are merged; no second pass and no unsharp mask | NXT cleans the sky; even a very gentle USM added speckle and lifted the sky level; running NXT twice was a mistake that was corrected |
| Hot pixel detection after NXT, on the HOO, the starless RGB and the stars-only image | Conservative detector: only isolated outliers are replaced, nothing is smoothed |
| RGB blended into the HOO (30 %, more around bright stars) rather than pure HOO | Neutral sky instead of a green-teal cast, and a more natural colour around the bright stars; chosen from the side-by-side comparison |
| Hand adjustments on the starless HOO+RGB before the stars: curves (gentle S), histogram (shadows 0.0253, highlights 0.9722, midtones 0.4893), unsharp mask (sigma 1.3, amount 0.76, lightness) | Contrast and sharpness are matters of taste and done by eye; stars are added only afterwards |
| Star colour: separate luminance and colour, blur the colour slightly, trim greens and purples (tested, adoption open) | Cleaner diffraction spikes and fewer purple fringes without softening the stars |
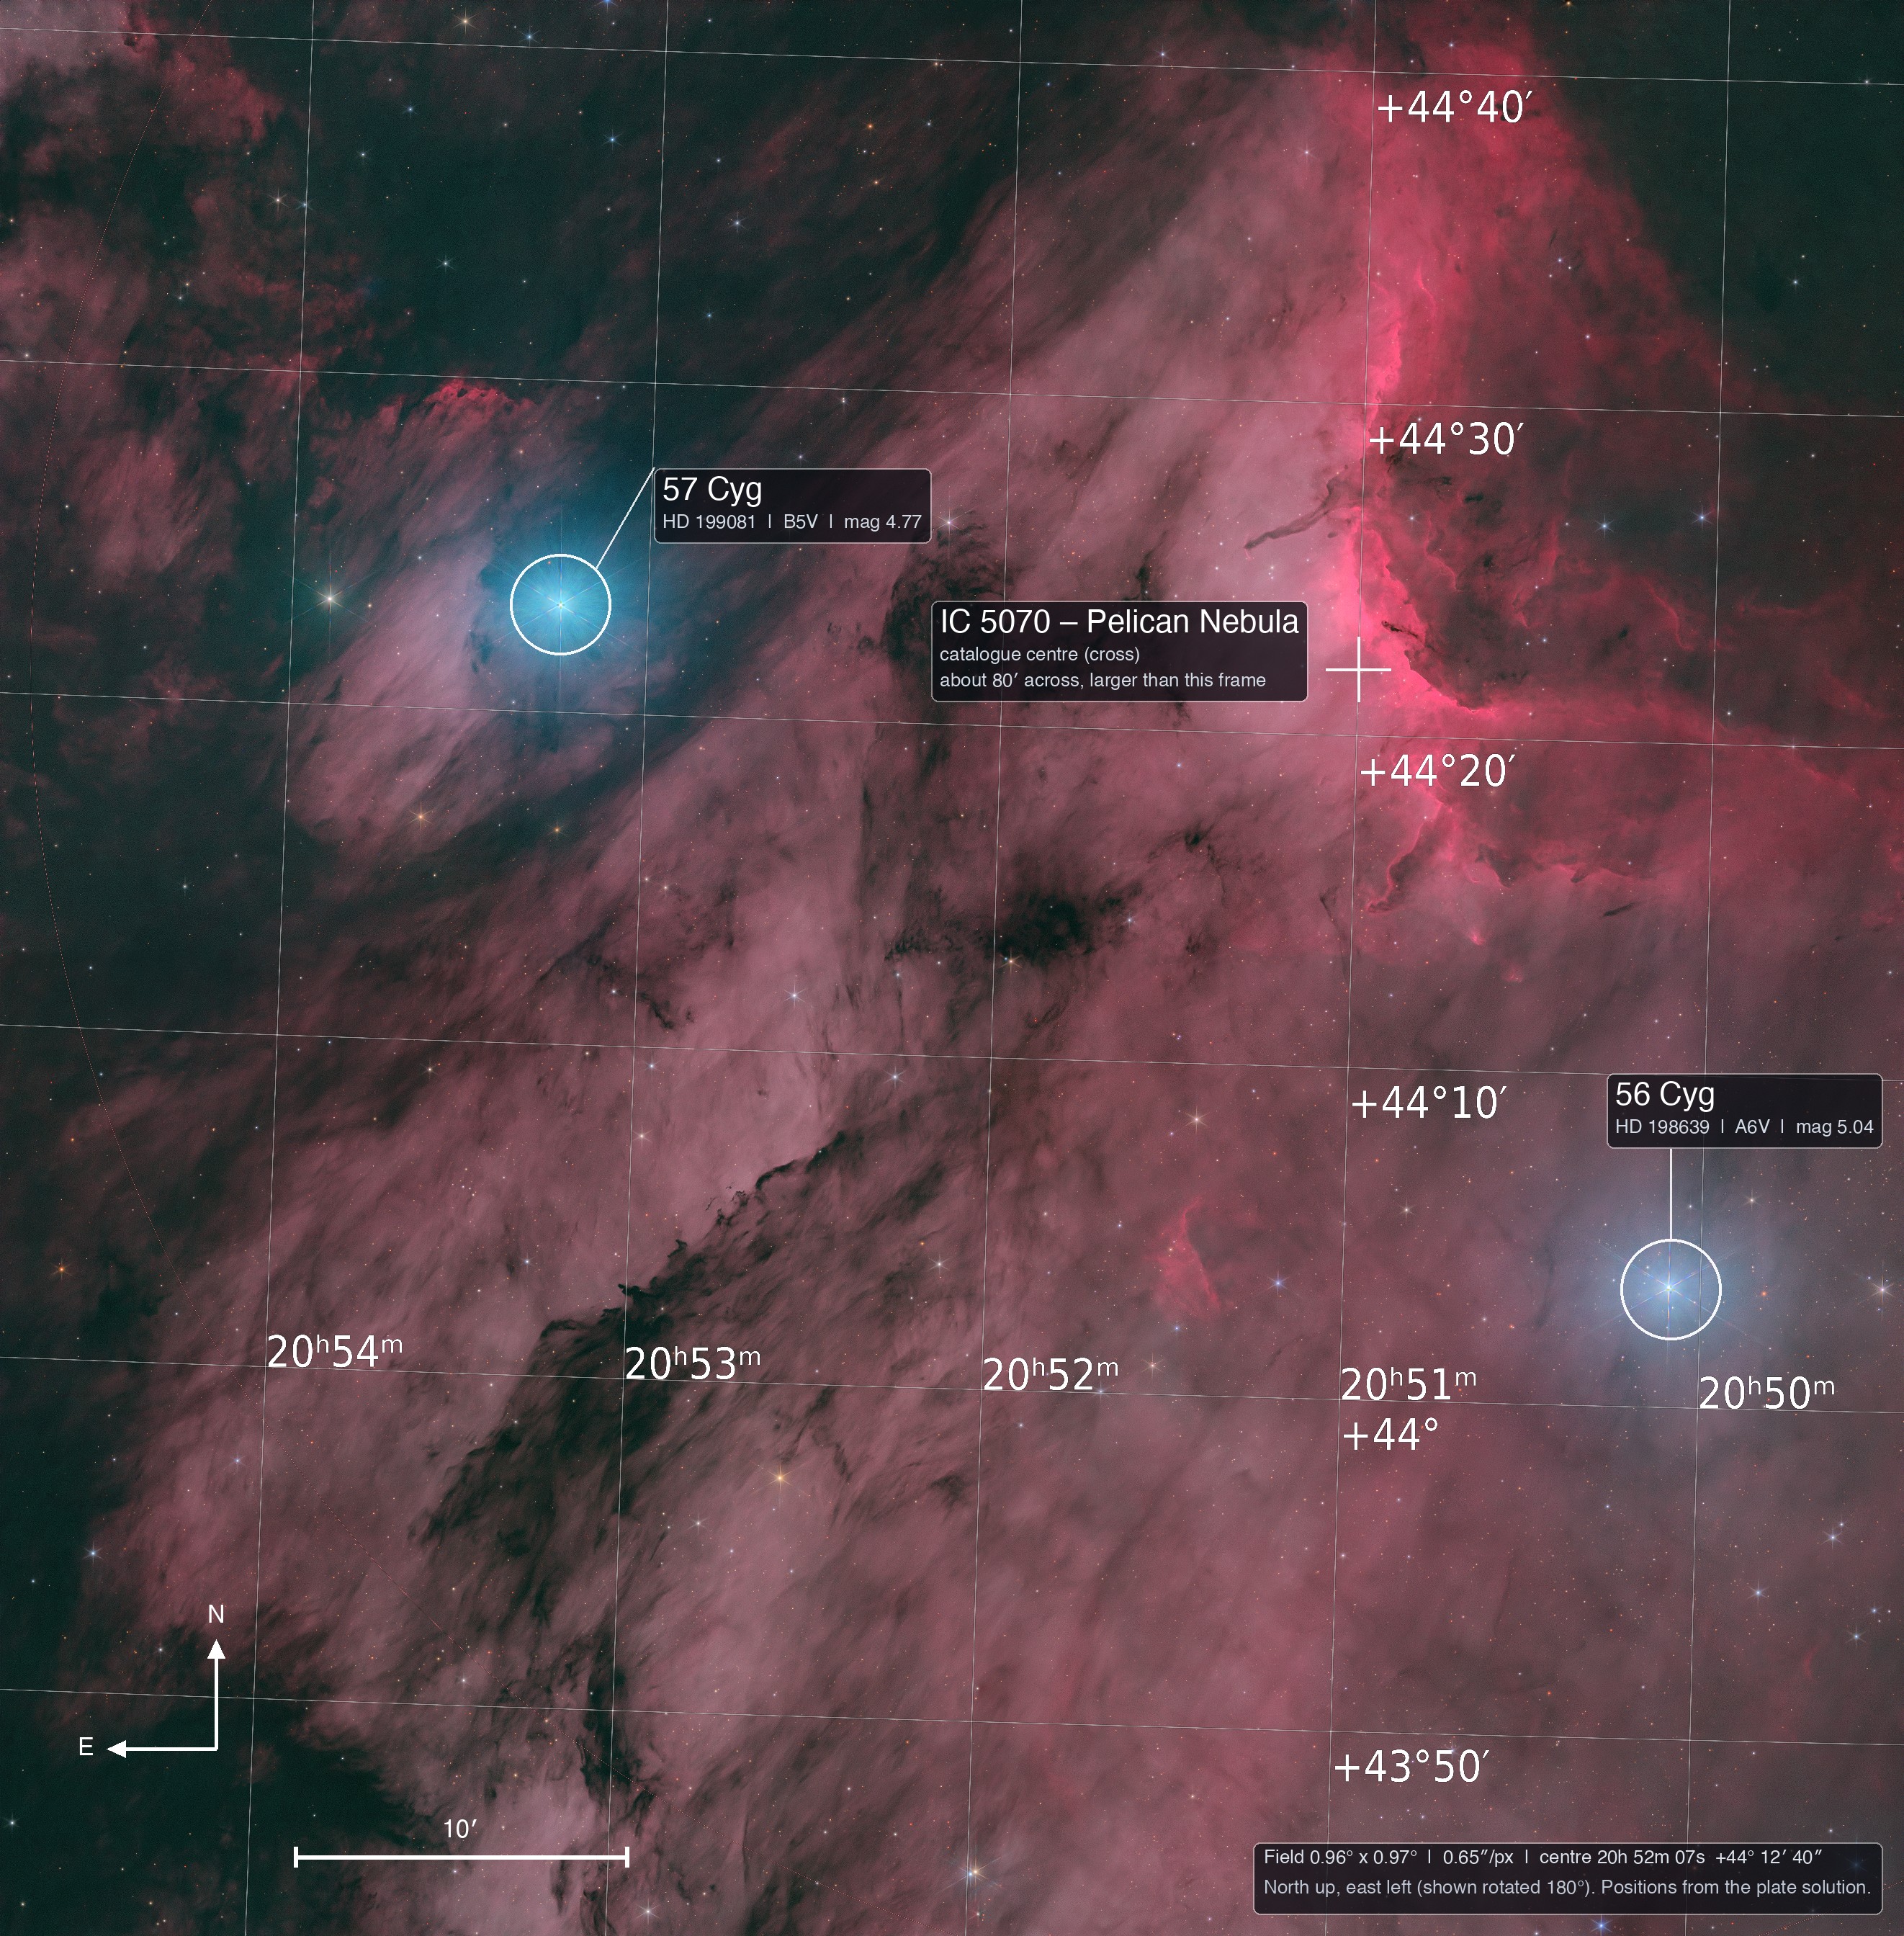
| Annotated version of the result shown on mouse-over: PixInsight AnnotateImage grid and catalogue labels, plus my own label boxes, north/east arrows and a 10′ scale bar | Lets the reader find the stars and the nebula; the blog shows it on hover, tap or button |
| A red ellipse on the annotated image marking where the Pelican shape is (outlined by the author on a screenshot; centre and size taken from it) | The nebula is named after a shape that is hard to see in a wide, rotated field; the marker shows the reader where to look |
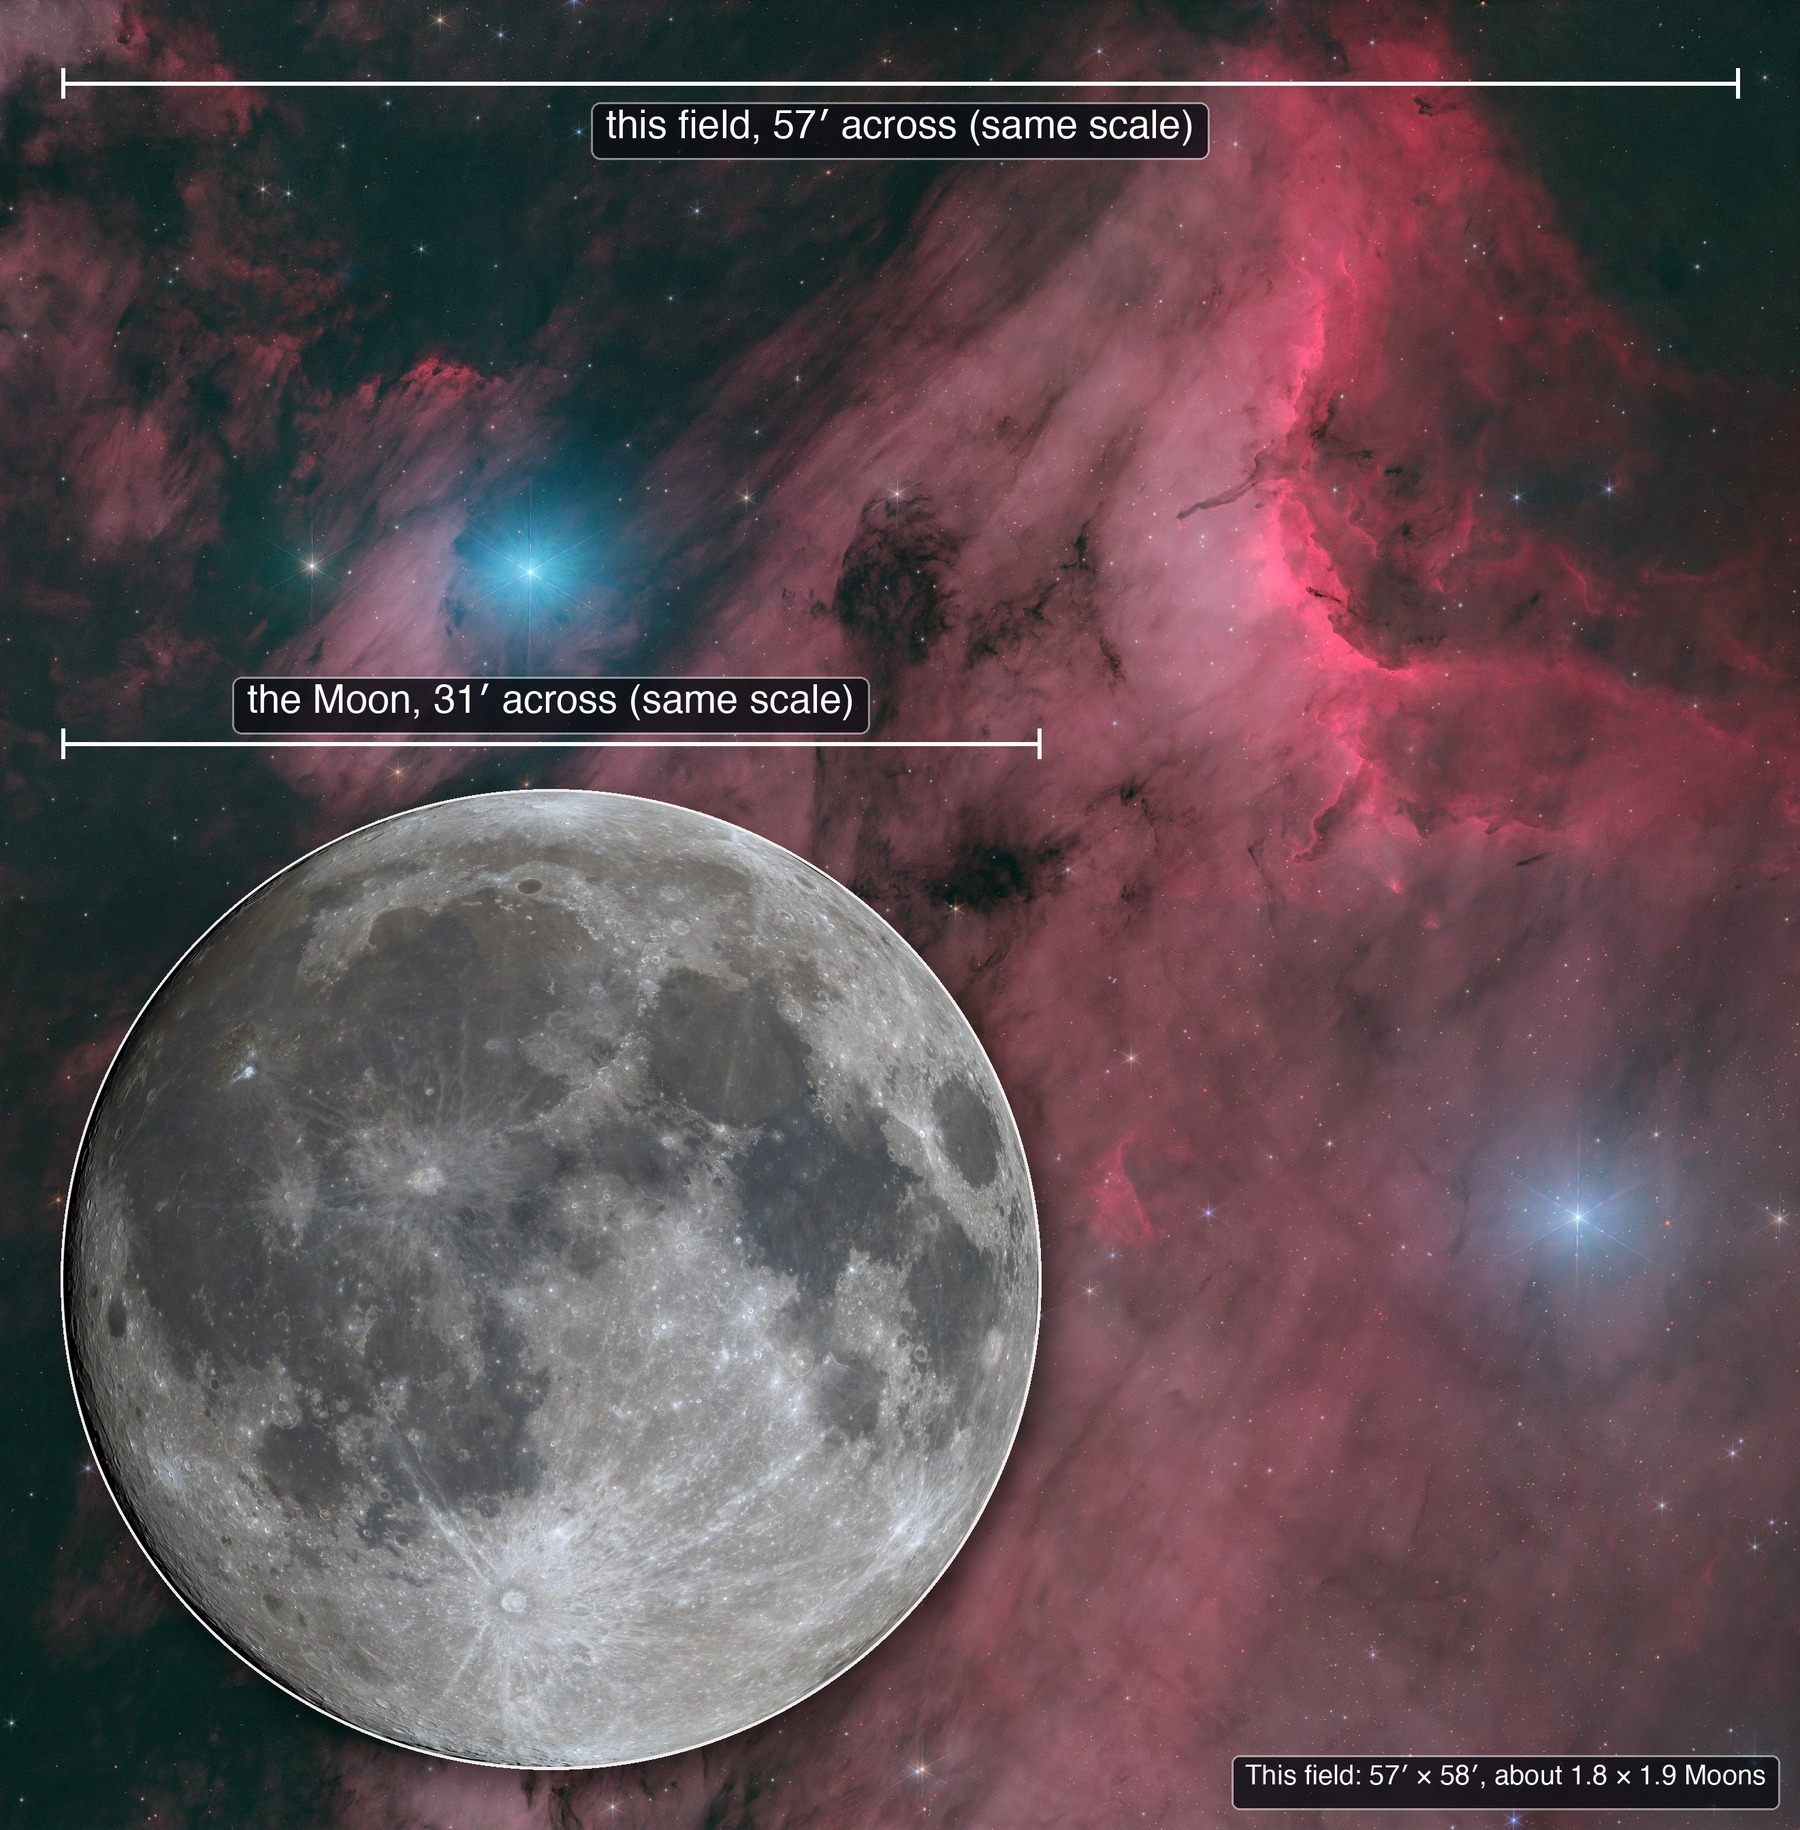
| Size comparison with the full Moon, as a separate figure | Gives the reader a feeling for the field (about 57′ × 58′, 1.8 Moons wide); kept off the annotated image on purpose |
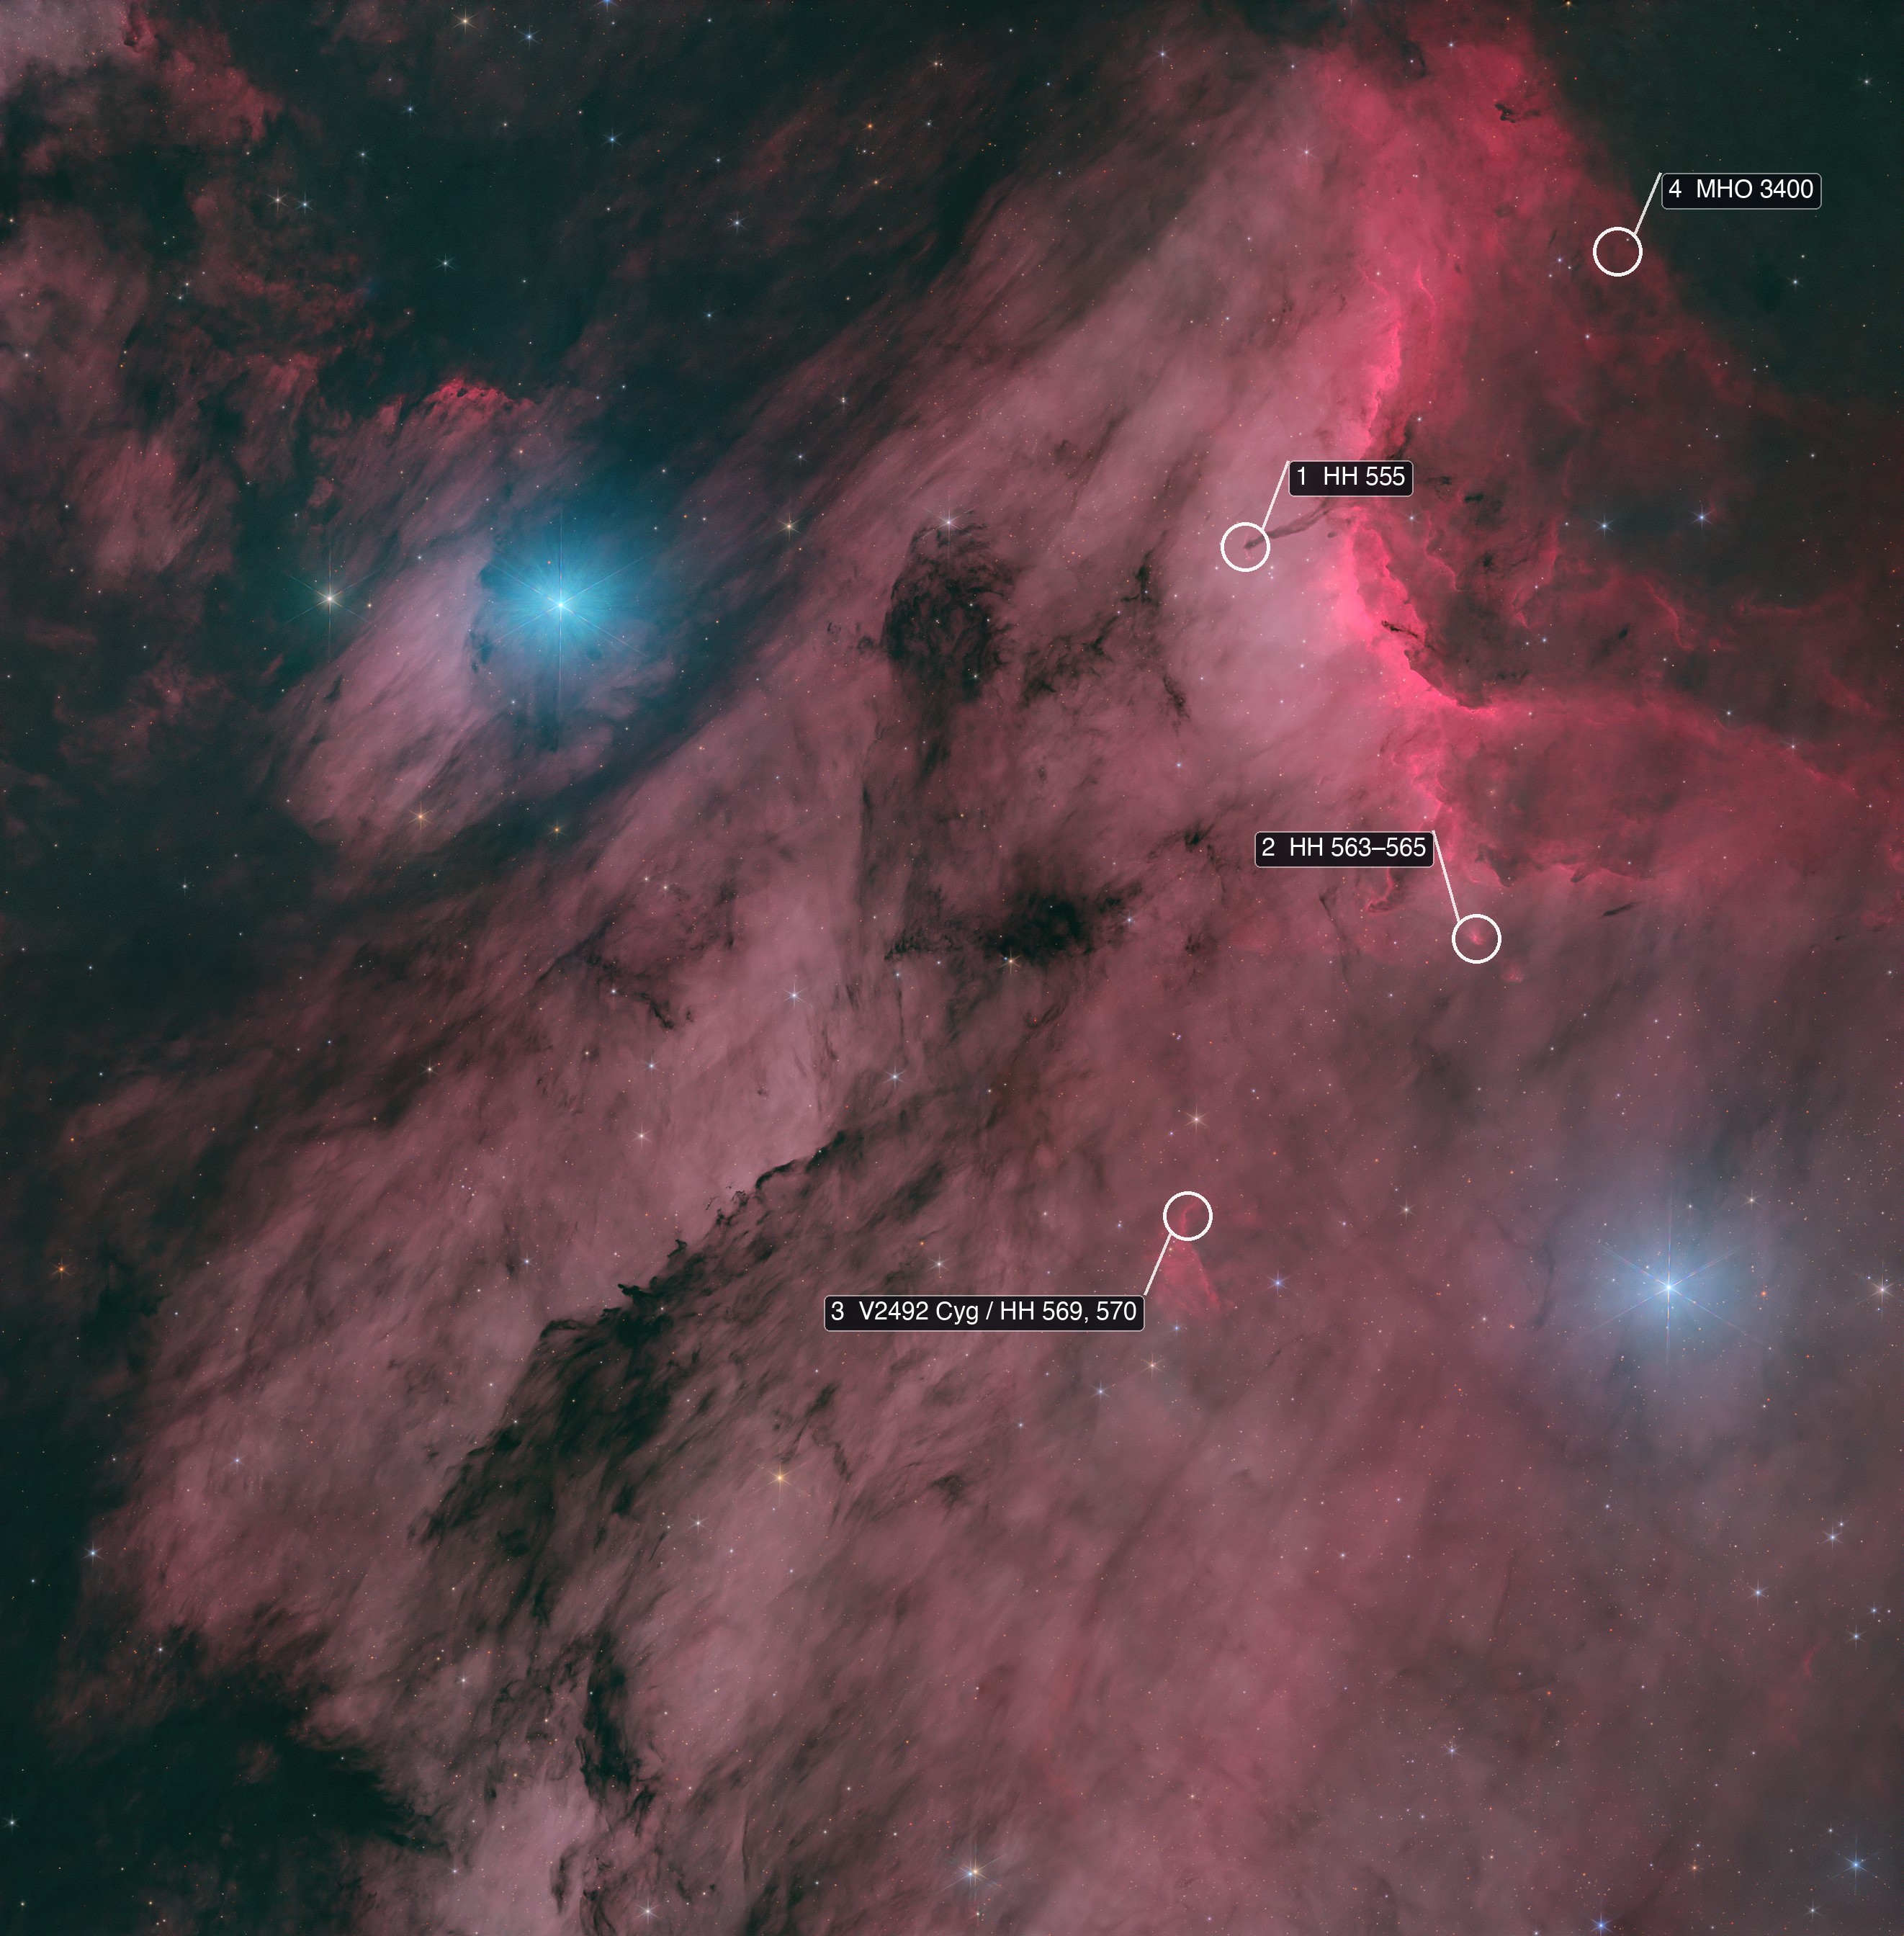
| A section on hidden objects found by converting catalogue positions (SIMBAD) to pixel positions with the plate solution, checking each on the image, and reading the papers | Gives the reader something to look for, and avoids claims that cannot be verified: only objects whose positions were verified are shown; statements that are my own reasoning are marked as such |
| Images shown rotated 180° | So that the Pelican reads the right way up |
Still open: the star saturation (×1.4 is used for now), the slight brightness step along the join between the top and bottom panels, and the strong teal OIII glow around the brightest star on the left.
20. Lessons for scripting PixInsight
- Headless works. A second instance started with
PixInsight -n --automation-mode -r=script.js --force-exitruns a script and exits, while the GUI instance stays untouched. - Add
#engine v8as the first line for anything that uses modern JavaScript (classes,#includeof the stock astrometry scripts). Without it,-rruns the legacy engine and such scripts fail silently: no output, no file, no error. - Capture the console. Wrap a process call in
Console.beginLog()/Console.endLog()and write the text to a file; that is how the real SPFC error message (“at least 5 items are required…”) became visible. - Union-mode StarAlignment cannot run on files. Register/Union modes only work on open views, which is why the reprojection route through the plate solutions was used.
- Read back what you wrote. Per-image statistics before and after each step and a before/after crop of a known-bad spot caught more problems than any log line.
- Do not reuse a full-image STF on a stars-only image. The shadows clip assumes a sky level that the stars image does not have, and silently deletes the faint stars.
- PixInsight’s AnnotateImage can be driven headless. Define
USE_ANNOTATE_LIBRARYandSETTINGS_MODULEbefore including the script, build anAnnotationEngine, and callRender(). It needs an astrometric solution. The final image had none, so the solution of the plate-solved RGB (same pixel grid) was copied over. The fast-rotation process drops the solution, so for the 180° rotated copy the linear part of the solution was transformed by hand and checked against a known star (within 0.1 px). - One folder per stage. It made it trivial to compare stages and to restart from any point.
21. Caveats and what’s next
- The border-star scan found 55 locations; the star masks come from an earlier, less sensitive pass that covered roughly six stars. I verified the ones I looked at, but not every one of the 55.
- SPFC and MGC changed the pixel values very little. I confirmed they ran correctly, not how much they improve the result.
- The brightness step along the left half of the join between the top and bottom panels is still in the data, and it is faintly visible in the final image.
- The strong teal OIII glow around the brightest star on the left is real signal in the data; its origin (emission or scattered light) was not determined. The RGB blend only moves it part of the way to the RGB colour.
- The annotation uses only the linear part of the plate solution (no lens-distortion terms) after the 180° rotation; positions are good to a few pixels. Only three catalogue objects fall in the frame (IC 5070, 57 Cyg, 56 Cyg). The Moon in the size comparison is scaled to 31.1′; on the date of the photo (25 September 2026) the real apparent size was between 30.7′ and 31.6′ (the exact time of the capture was not available), so the comparison is accurate to about 1.5 %.
- Star saturation (×1.4 is used for now) and the exact RGB share of the blend were chosen by eye from a small set of options.
- The 100 % crops and previews in this post were checked on a few regions only, not across the whole frame.
The next stage is the finishing: final colour and contrast adjustments on the merged image, a decision on the panel seam and the OIII glow, and an export. The files to start from are listed at the end of section 17.
22. Paths not taken
These did not make it into the final pipeline, but they are worth keeping: the very first exploratory round, before the real iterative process (rounds 2 onward) took over, and a list of smaller options that were tried or considered and set aside. Nothing here is part of the workflow above.
The three merges: first drafts
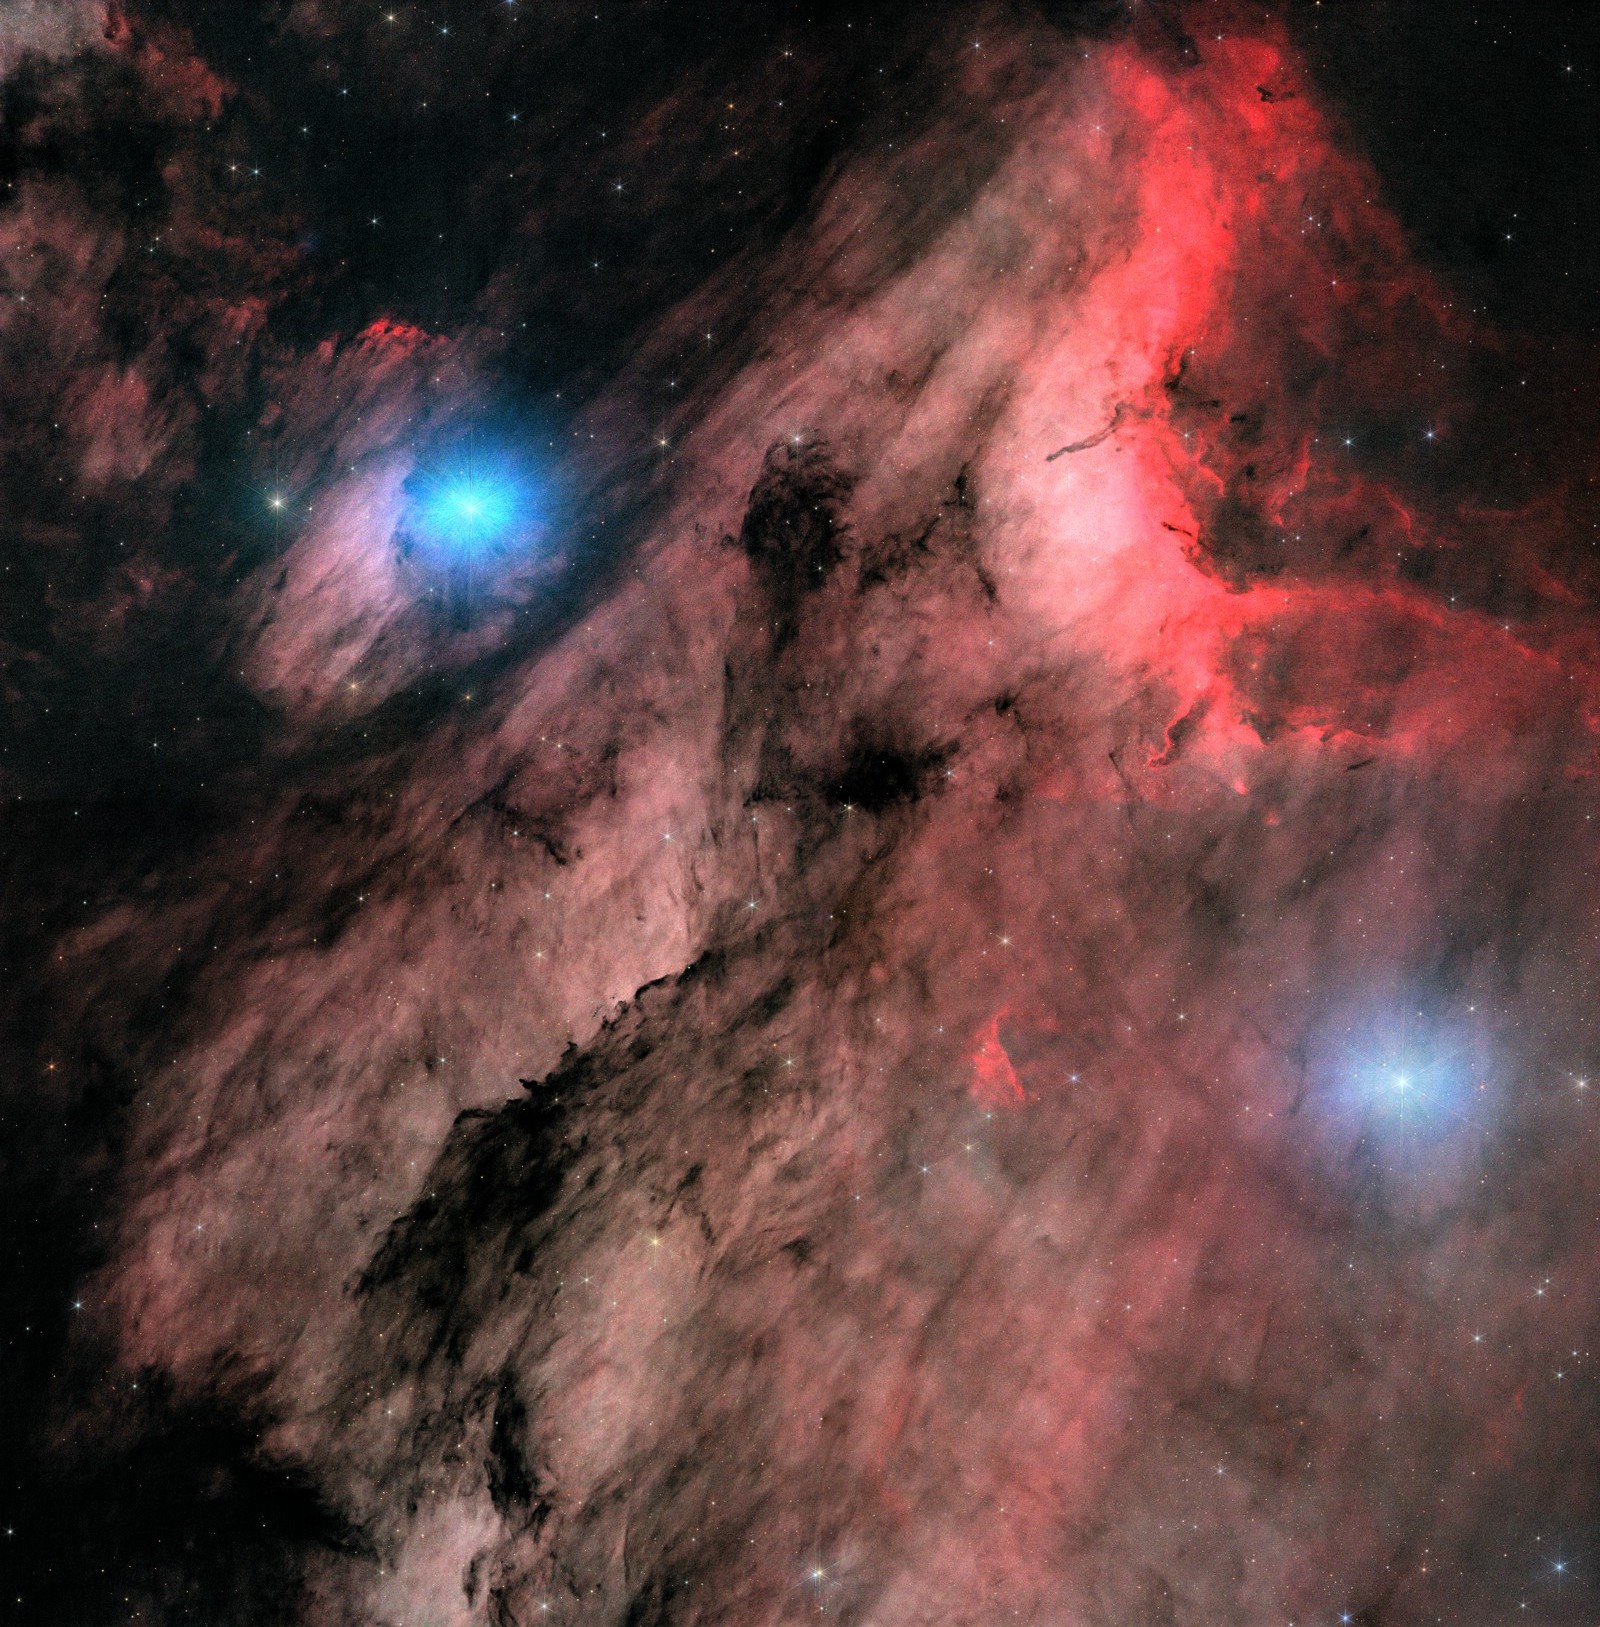
All three options were built from the same ingredients, so they can be compared fairly. The starless/stars split was done with StarXTerminator (with aureole removal switched on for the RGB, to take the big halos out of the starless image), followed by NoiseXTerminator at 0.6 on each starless layer, while the data were still linear. The continuum factors were measured from the stars themselves, about 6,000 unsaturated star pixels: Hα/R = 0.395 and OIII/G = 0.484. Stars were stretched separately and lightly, then screen-blended back on top of every variant.
Option 1 · RGB boosted with continuum-subtracted narrowband
Option 2 · HOO starless blend with RGB stars
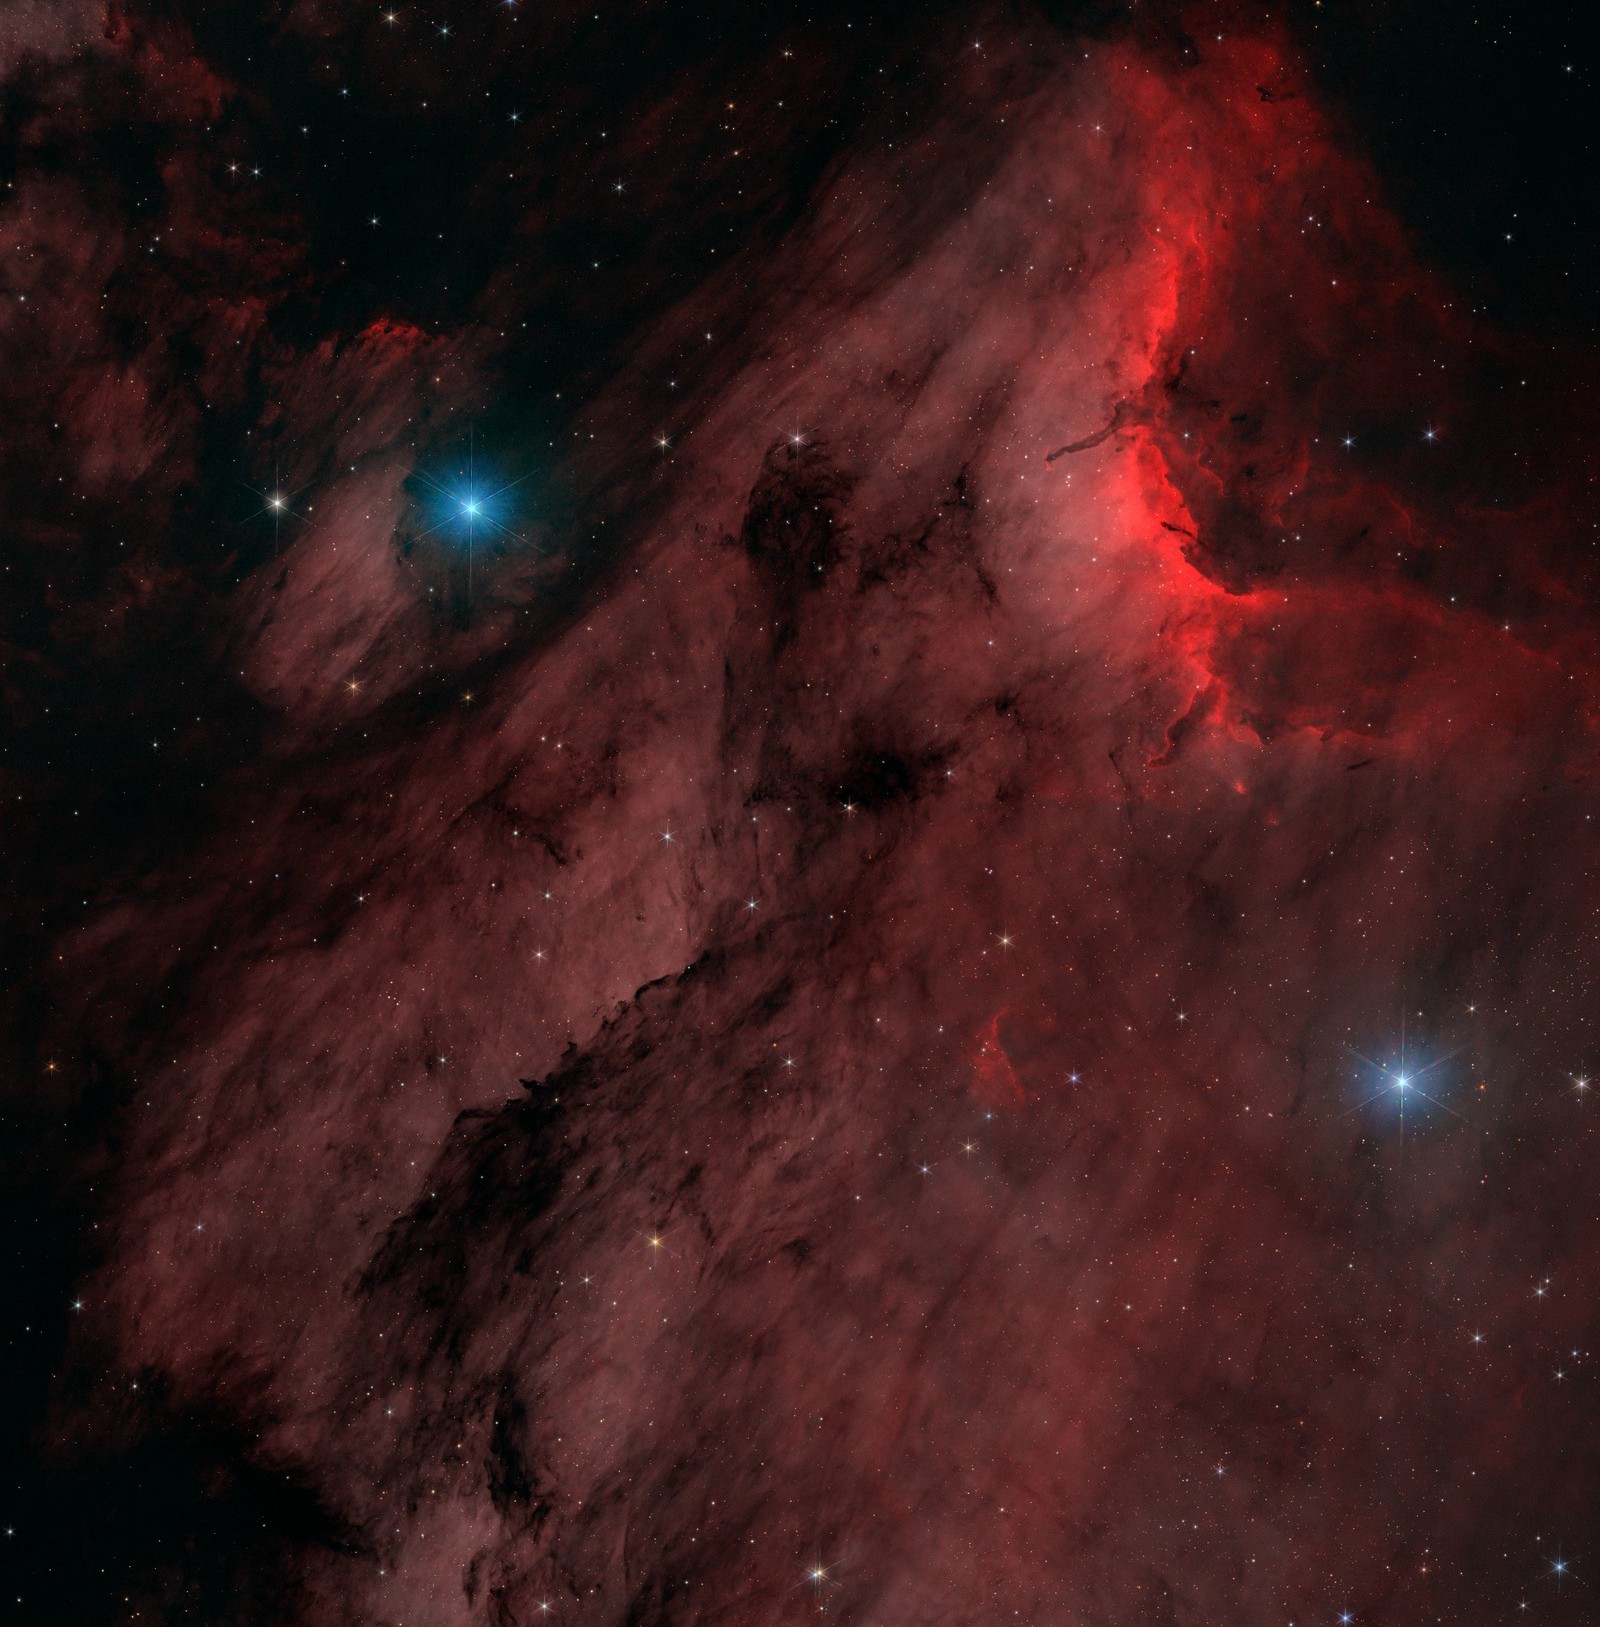
Option 3 · Narrowband as luminance, RGB for colour
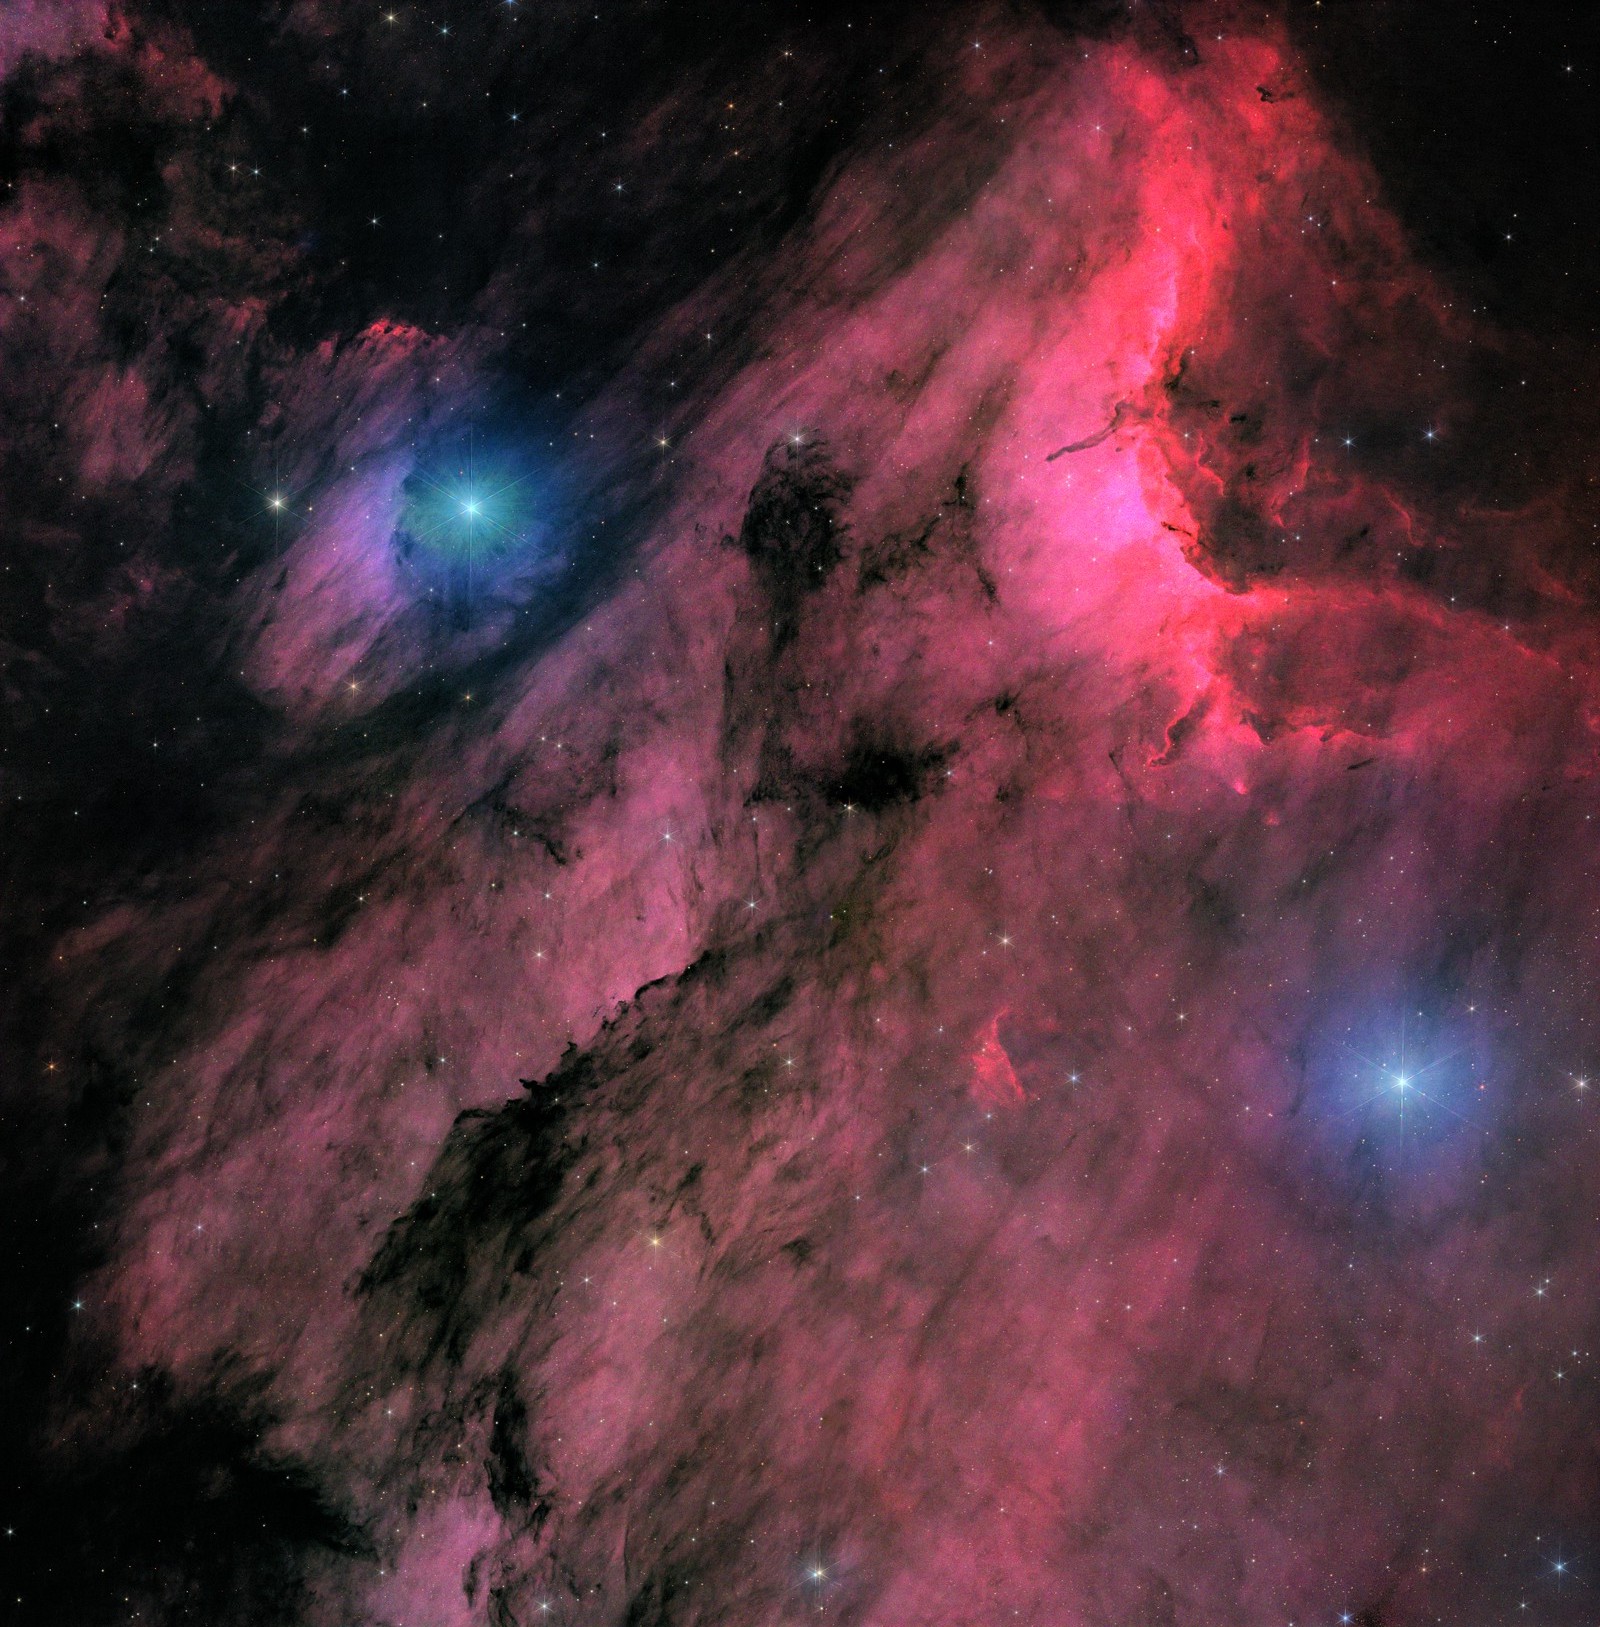
| Colour source | Detail source | Look | |
|---|---|---|---|
| 1 | RGB, plus narrowband added | RGB + Hα/OIII boost | Natural, red glow, brown dust |
| 2 | False colour: Hα→R, OIII→G,B | Hα and OIII | Deep red with teal accents, darkest sky |
| 3 | RGB | Hα/OIII luminance | Most contrast, magenta-leaning |
What I saw, and what still needed work
- A brightness step across the left half of the join between the top and bottom panels. It is visible in all three results under this stronger stretch, and it comes from the mosaic itself. There the two panels overlap by only a few pixels, so the merge cannot smooth out the sky-level difference between them (I measured about 15 % earlier). Fixing it means balancing the sky level of the two panels along that join, or reworking how those two panels are blended.
- Blue halos around the two brightest stars. Removing aureoles made them much smaller than in my first attempt, but they are still bluer and larger than in the red channel. A second pass with reflections removed, or a local colour correction, would tame them.
- These are first drafts. The stretch is a simple colour-preserving one with a black point at the 4th percentile, and the boost weights, the OIII scale and the luminance mix are my own choices, not tuned by eye. They are meant to show how the three options differ.
What was tried or considered, and not chosen
| Option | Why it was not chosen |
|---|---|
| Reproject the panels with StarAlignment in union mode | Union modes only work on open views, not on files, so the plate solutions were used instead |
| The default GradientMergeMosaic edge shrink (1 px) | It erased the thin overlap and left a dark wedge at the left edge |
| An aggressive mask that blanked every duplicate halo where panels overlap thinly | It left large black areas where the blanked region ended |
| Option 3, narrowband as luminance | Most contrast and detail, but the colour leaned magenta; not developed further after the first draft |
| The first HOO, with each channel stretched on its own | It came out almost entirely cyan because the weak OIII was stretched as hard as the Hα |
| A hard stretch with a black sky | The black was too black; no sky is that dark |
| Sky at 0.15 as the only target | Judged slightly bright, so 0.10 and 0.125 were compared (0.125 is currently used) |
| Stretching the stars with the full STF of the RGB | Clipped about 3,800 pixels in the bright stars’ cores |
| Reusing the STF shadows clip on the stars-only image | It deleted most of the faint stars, because that image has no sky level |
| Aureole removal in StarXTerminator as a fix for the star problems | It made no difference to the stars image; the problem was elsewhere |
| Using aureole removal on the narrowband to remove the glow around the left star | No change either; the OIII glow is in the data |
| A gentle unsharp mask (0.10 and 0.20) | Added speckle to the sky and lifted its level; noise rose about fourfold |
| Stretching the stars with a gentler midtones curve (S2) | Kept the highlights but lost the faint stars; the arcsinh handled both better |
| Doing the narrowband blend at 0 % RGB everywhere | The pure HOO leaves the bright stars sitting in a teal glow; kept as a comparison only |